
Fig. 2.
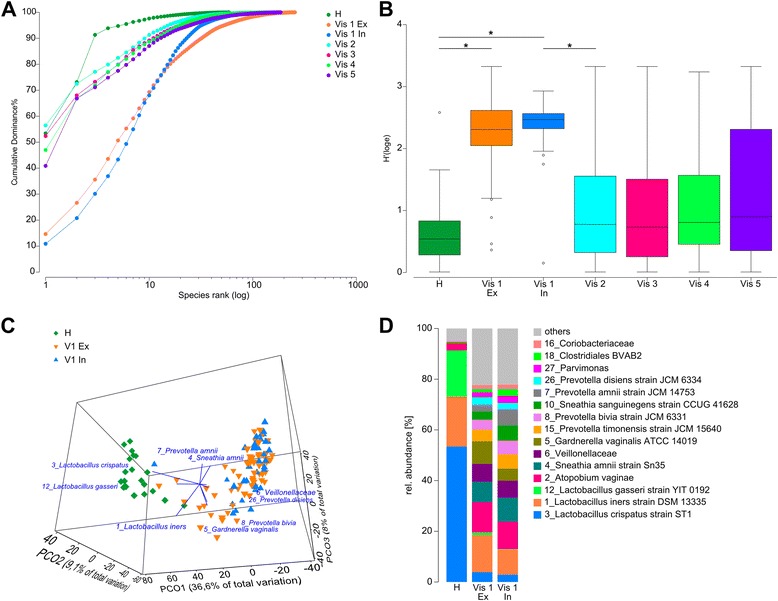
Rank abundance and Shannon diversity of vaginal microbiota. a Dominance plot of cumulated samples from all visits. H health, vis/v visit, ex excluded, in included. b Shannon indices of all groups. Mean and quartile range are shown. Asterisks indicate significant (p < 0.01) differences assessed by a Wilcoxon rank sum test. c PCO of healthy women and included or excluded women with acute BV. d Cumulated abundances for each group. OTUs below 1% relative abundance are summarized as others.