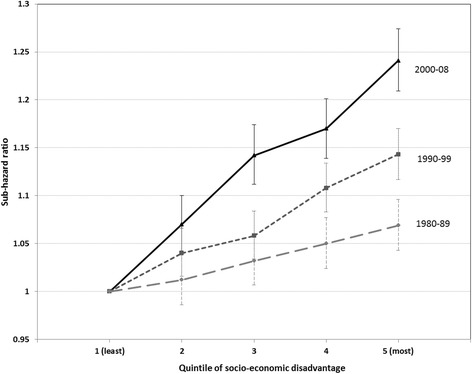
Fig. 1.

Sub-hazard ratios for socio-economic disadvantage quintiles 2–5 compared with quintile 1 for cases diagnosed in 1980–1989, 1990–1999 and 2000–2008. Sub-hazard ratios with 95% confidence intervals. Socio-economic disadvantage measured as the Index of Relative Socio-Economic Disadvantage and categorised into quintiles (1: least disadvantaged – 5: most disadvantaged). Models adjusted for sex, age, remoteness, country of birth, cancer site, and summary stage
