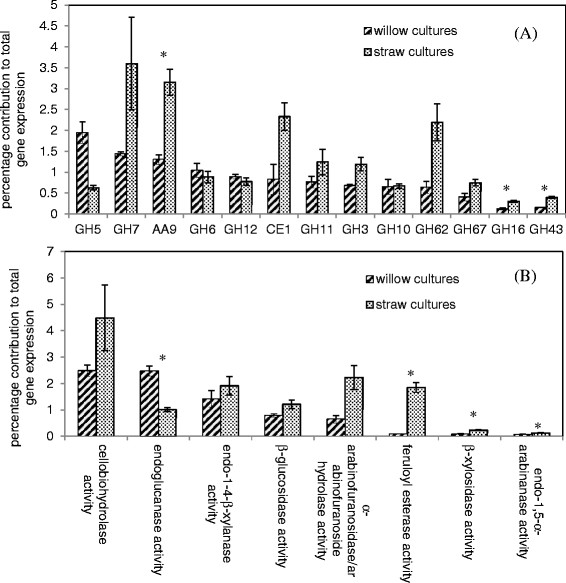
Figure 2.

Expression per (A) CAZy family and (B) selected enzyme activities as a percentage of total gene expression. For (A), only those families with total RPKM values of 100 or more upon at least one of the substrates are shown. Gene expression was measured following 24 h culturing of A. niger in the presence of willow or wheat straw as the only carbon source. The families and activities are presented in order of decreasing expression from the willow cultures. The error bars represent standard error. Genes were assigned to particular enzyme activities as described in Methods section and Additional file 7. A ‘*’ symbol is used to indicate whether the differences between willow and straw cultures were statistically significant (unequal variances t-test, p <0.05).
