Figure 2.

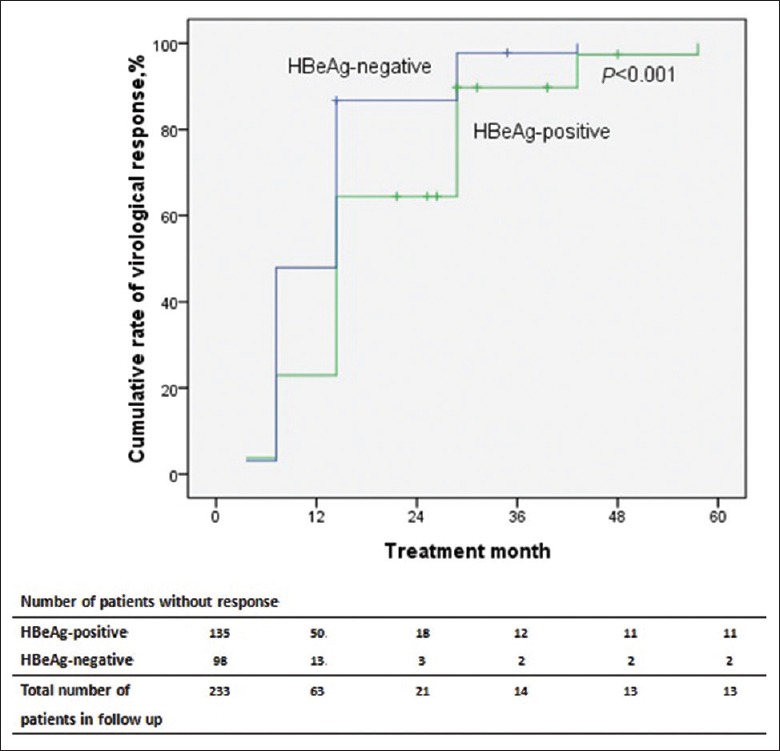
Kaplan–Meier curve for the probability of achieving virological response for all patients according to HBeAg status at baseline. P value was determined using log-rank testing.

Kaplan–Meier curve for the probability of achieving virological response for all patients according to HBeAg status at baseline. P value was determined using log-rank testing.