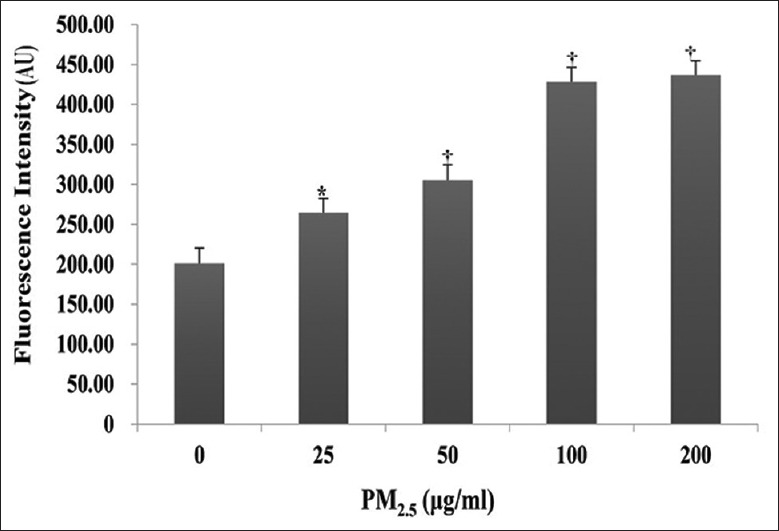
Figure 3.

Effect of PM2.5 on reactive oxygen species generation in HaCaT cells. HaCaT cells were exposed to 0, 25, 50, 100, or 200 μg/ml PM2.5 for 24 h. Results were measured as mean fluorescence (AU). *P < 0.05, †P < 0.01 versus unexposed control cells. AU: Arbitrary unit.
