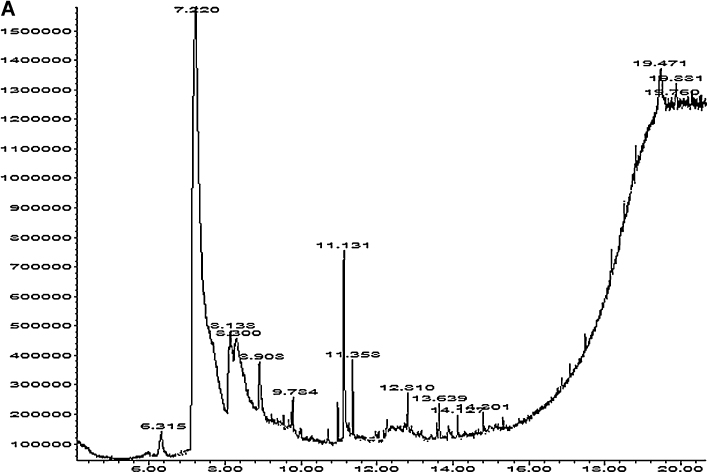
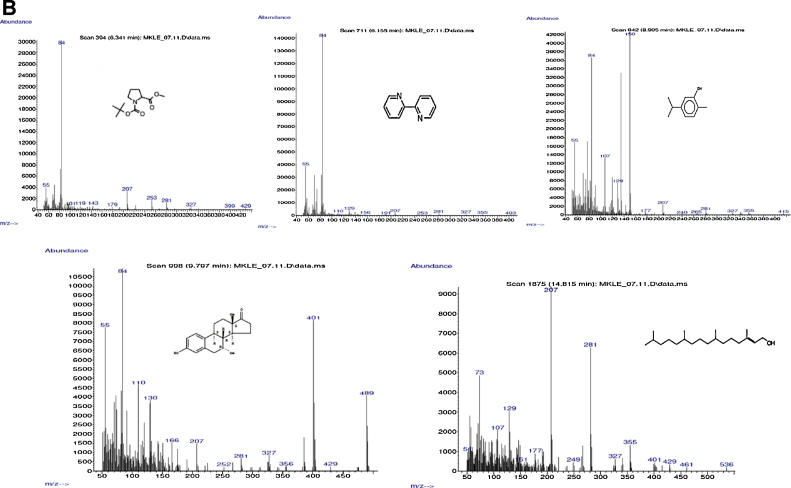
Fig. 7.
(A) The representative figure for gas chromatogram of the extract. (B) The representative figures for the mass spectrometry. Upper panel shows the mass spectrometric data of the chromatographic peaks obtained at 6.341 min, 7.245 min and 8.905 min. Lower panel shows the mass spectrometric data of the chromatographic peaks obtained at peak at 9.797 min and 14.815 min.


