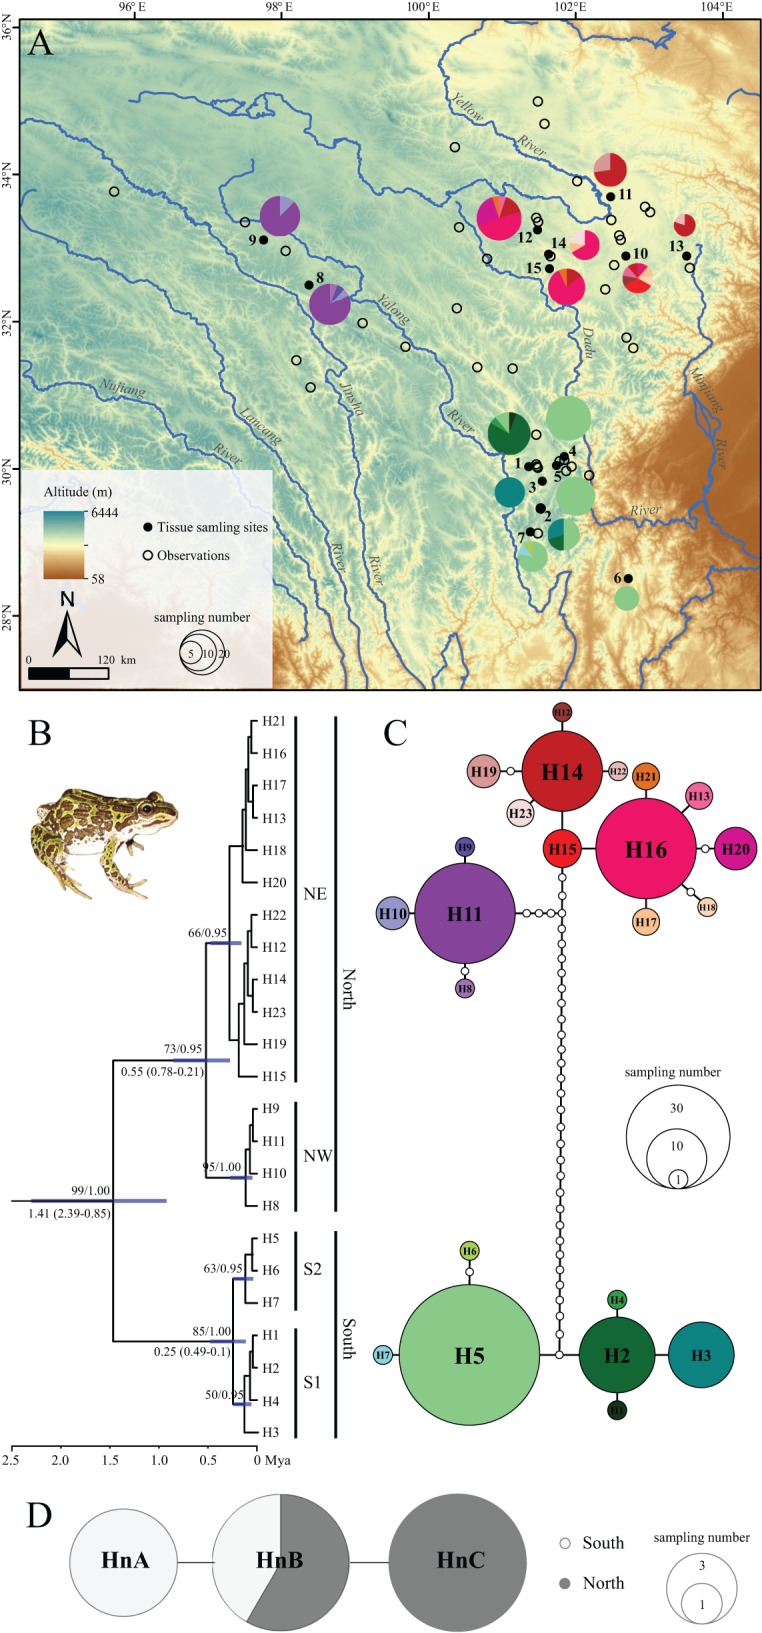
Figure 1. Sampling localities, phylogenetic tree and TCS haplotype network for Nanorana pleskei.

(A) Sampling localities. The pies represent the haplotype (H1–H23; colors for each haplotype refer to C haplotype network) frequency in each population. (B) Phyloengetic tree. Maximum likelihood bootstrap support values/Bayesian posterior probabilities are above the branches. Mean time (Mya) to the most recent common ancestor (TMRCA) with 95% highest posterior density (95% HPD) for the key nodes are given below the relative branches. (C) Haplotype network for mitochondrial DNA data. Colors in the haplotype network represent different haplotypes. Sizes of cycles indicate the haplotype frequencies. Network branches linking the cycles indicate one mutation step; more mutations are represented by dark spots crossed with the branches. (D) Haplotype network for nuclear DNA data. MtDNA lineage South was offwhite, and mtDNA lineage North was dark grey.
