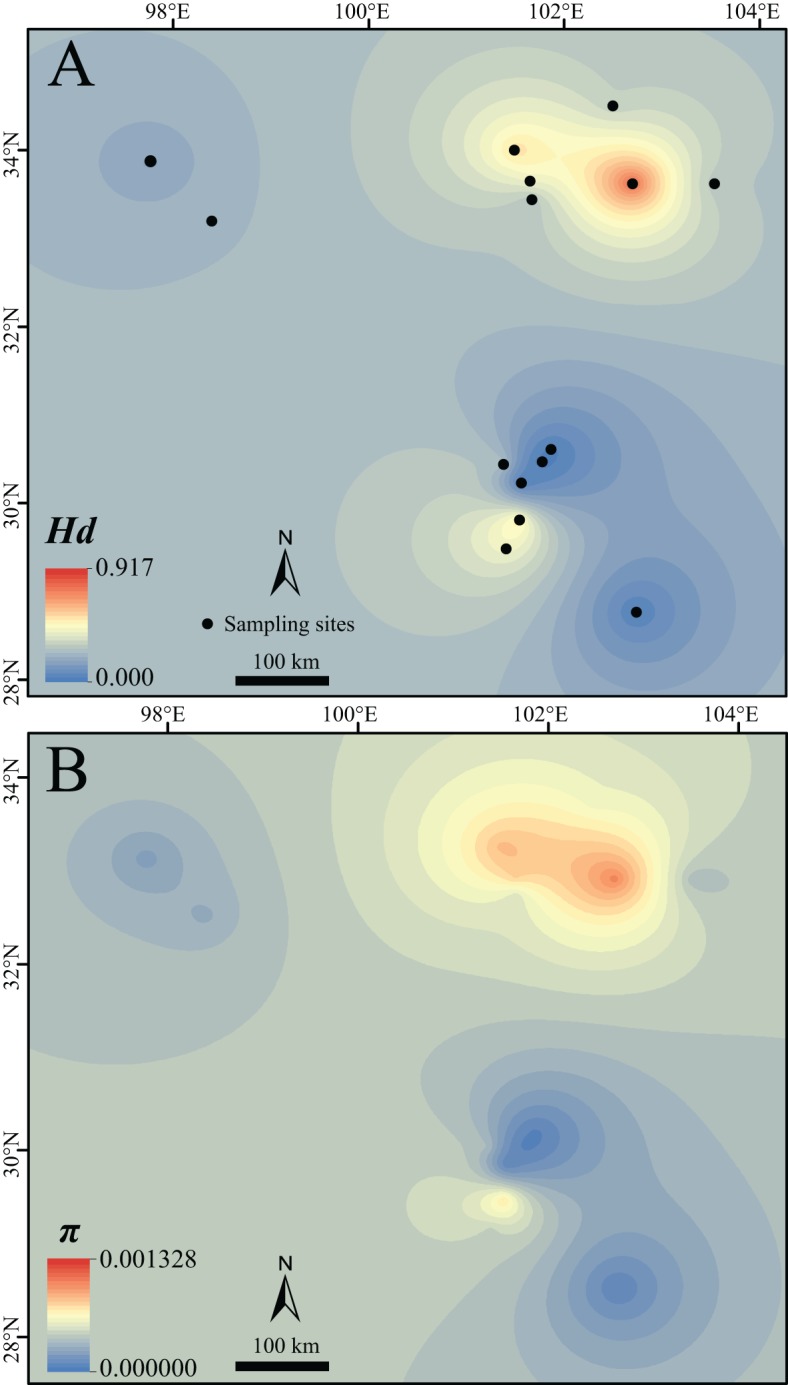
Figure 2. Surface of the interpolated genetic diversity of Nanorana pleskei.

(A) Hd, haplotype diversity. (B) π, nucleotide diversity. Warmer color indicates higher genetic diversity. The interpolation was conducted under a kriging framework.

(A) Hd, haplotype diversity. (B) π, nucleotide diversity. Warmer color indicates higher genetic diversity. The interpolation was conducted under a kriging framework.