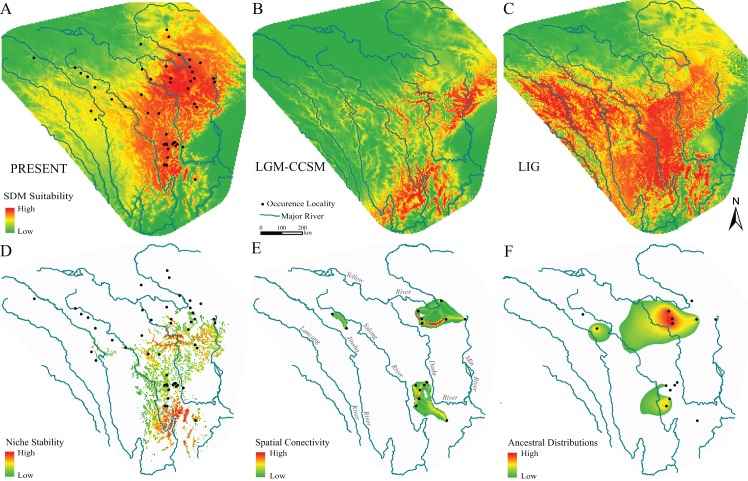
Figure 4. Species distribution models, hypotheses of habitats stability and spatial genetic patterns of Nanorana pleskei.
(A–C) Species distribution models of Nanorana pleskei under present and paleo periods: (A) present time; (B) LGM–CCSM; (C) LIG. (D) Stability of the niche of Nanorana pleskei through all periods based on a species distribution model. (E) Dispersal networks of Nanorana pleskei depicting the connectivity of populations through suitable habitat. (F) Relative age and areas of ancestral distributions of mtDNA lineages as inferred by RASP. Warmer colors depict higher probability.

