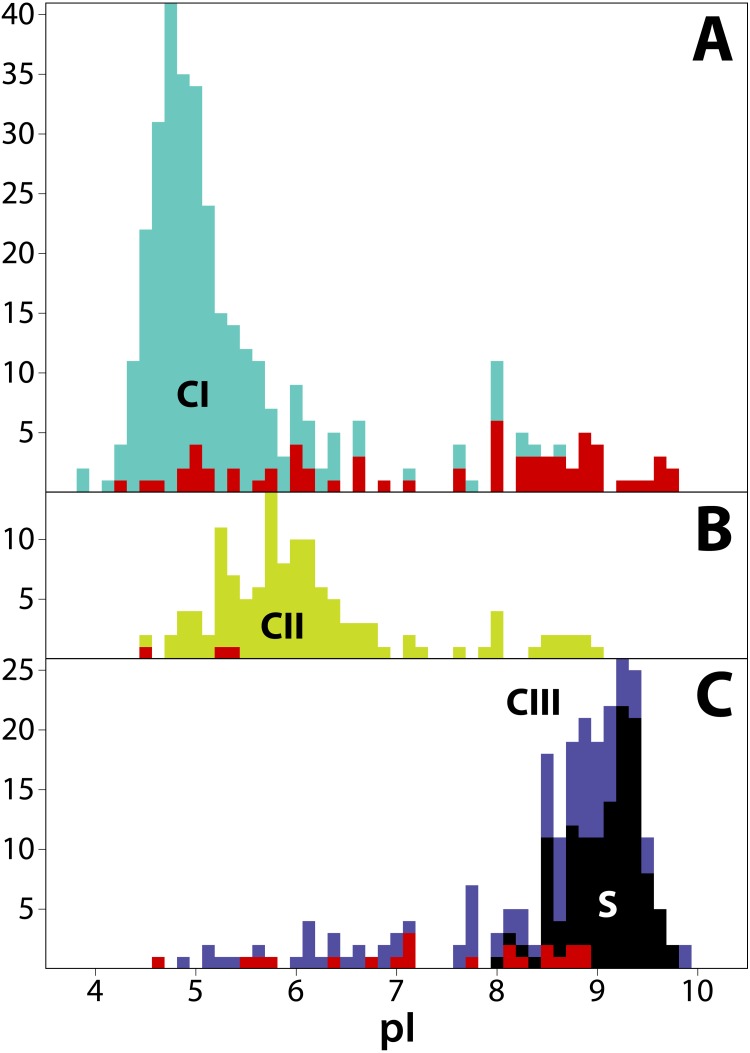
Figure 4. Frequency distribution of isoelectric points (pI) for 711 T2/S-RNases in land plants, separated by phylogenetic group (‘class’).
Classes are consistently colored as before. (A) Class I (green, n = 349). (B) Class II (yellow, n = 125). (C) Class III (purple, n = 237). Red bars indicate sequences known to lack RNase function (or inferred to lack the function based on absence of a histidine essential for that function). Black bars represent known S-RNase sequences. Note that functional S-RNases rarely display pI < 8.0, which is otherwise common in T2/S-RNases.

