
Figure 4. Transcriptome analysis of primary pre-osteoblasts (T5) shows downregulation of genes related to bone mineralization.
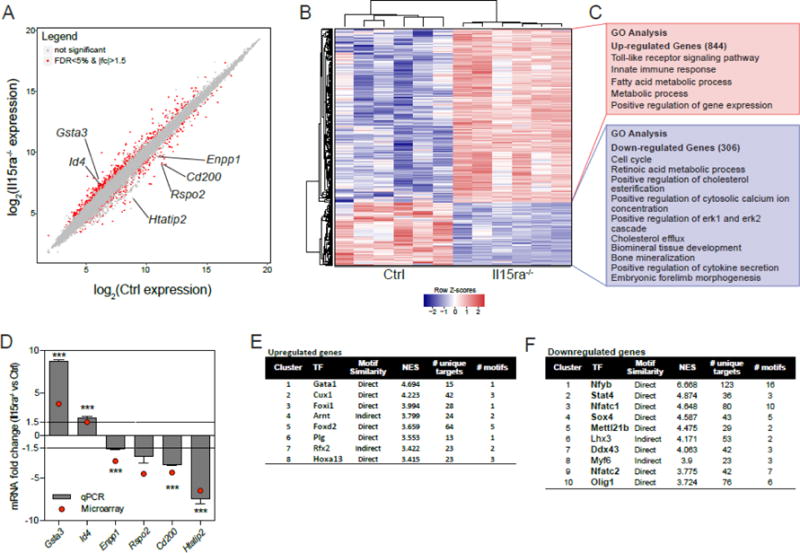
(A) Scatterplot representation of log2 expression values (FDR<5% and 1.5 fold change are shown in red). (B) Heatmap representation of differentially expressed genes (FDR<5% and 1.5 fold change), with (C) the most enriched Gene Ontology categories according to DAVID analysis. (D) qPCR validation of bone-related transcripts. Predicted transcription factors associated with upregulated (E) and downregulated (F) genes.