
Figure 5. Comparison with MC3T3 gene expression after 5 days of differentiation.
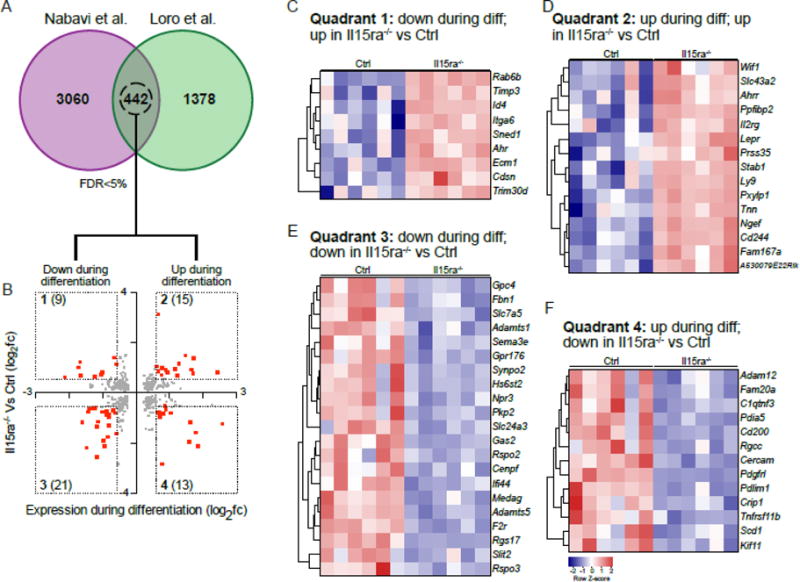
(A) Venn diagram of genes with FDR<5% in the two datasets. (B) scatterplot representation of the 442 genes shared between the two datasets, with il15ra−/− vs Ctrl log2 fold changes on the y-axis and undifferentiated Vs T5-differentiated MC3T3 log2 fold changes on x-axis. The number of differentially expressed genes with fold change >1.5 or <−1.5 (red dots) is reported within brackets. (C, D, E, F) Heatmap representations of genes contained in each quadrant.