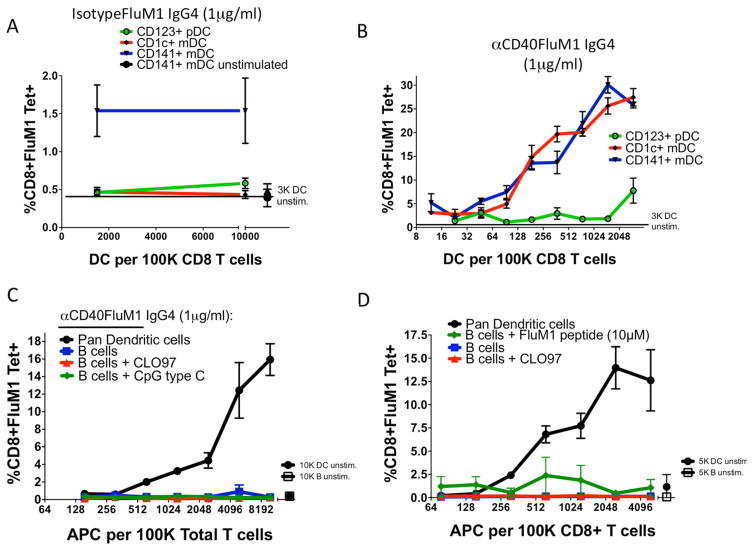
Figure 2. Antigen presentation by human DC subsets after antigen targeting in vitro.
Titrated numbers of FACS-purified human blood DC subsets were cultured with either (A) non-targeted isotype control-FluM1 IgG4 (1μg/ml) or (B) αCD40-FluM1 IgG4 (1μg/ml). Lines indicate FluM1-specific CD8+ T-cell responses generated by CD141+ DCs (blue), CD1c+ DCs (red), and CD123+ plasmacytoid (p)DCs (green). Data is representative of three different experiments using different human donors. (C–D) Two separate experiments from the same donor in which negatively selected purified DCs or B cells are co-cultured with total T cells (C) or CD8+ T cells alone (D). Black lines indicate FluM1-specific CD8+ T-cell responses in co-cultures containing human blood DCs and αCD40-FluM1 IgG4 (1μg/ml), blue lines indicate human B cells and αCD40-FluM1 IgG4 (1μg/ml), red lines indicate B cells stimulated with CLO97 (1μg/ml) and αCD40-FluM1 IgG4 (1μg/ml), and green lines indicate in (C) B cells stimulated with CpG C (1μg/ml) and αCD40-FluM1 IgG4 (1μg/ml) or in (D) B cells and 10μM FluM1 peptide.

