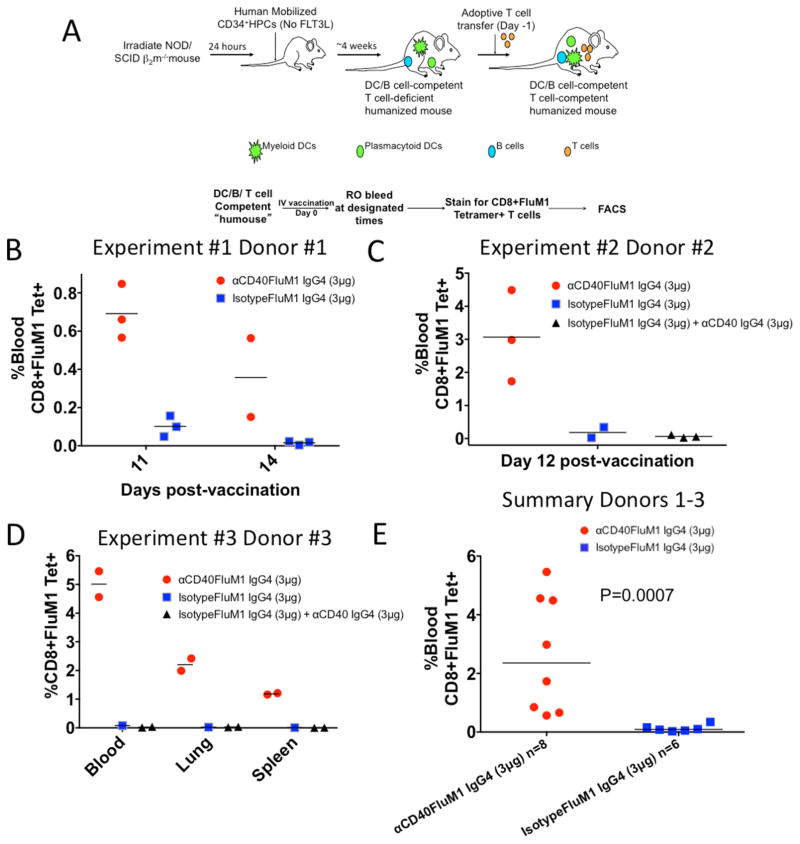
Figure 3. Human FluM1-specific CD8+ T-cell responses in vivo.
(A) Cartoon demonstrating a typical humanized mouse experiment. (B) Graphical representation of an experiment in which HM-T were vaccinated IV with either 3 μg αCD40-FluM1 IgG4 or 3 μg isotype control-FluM1 IgG4. The percentage of blood FluM1–specific CD8+ T cells was determined at days 11 and 14 post-vaccination. Each dot or square represents a single mouse. One αCD40-FluM1 IgG4 vaccinated mouse died between days 11 and 14. (C) A separate experiment in which groups of HM-T were vaccinated with 3 μg αCD40-FluM1 IgG4, 3 μg isotype control-FluM1 IgG4, or 3 μg isotype control-FluM1 IgG4 and 3 μg αCD40 IgG4. At day 12 post-vaccination, blood was analyzed to determine the percentage of FluM1-specific CD8+ T cells in each vaccination group. Each dot, square or triangle represents a single mouse. (D) Repeat of the experiment depicted in (B) except the lung and spleen compartments were also analyzed for FluM1-specific CD8+ T cells. (E) A summary of data from B–D comparing αCD40-FluM1 IgG4 and isotype control-FluM1 IgG4 at days 11 and 12 post-vaccination using a two-tailed non-parametric Mann-Whitney test. P<0.05 is a statistically significant difference. Red circles indicate mice vaccinated with 3 μg αCD40-FluM1 IgG4, blue squares are mice vaccinated with 3 μg isotype control-FluM1 IgG4, and black triangles are mice vaccinated with 3 μg isotype control-FluM1 IgG4 and 3 μg αCD40. Each experiment in B–D utilized a different human donor. FluM1-specific CD8+ T cells were enumerated by FluM1-specific MHC class I tetramer staining and FACS.

