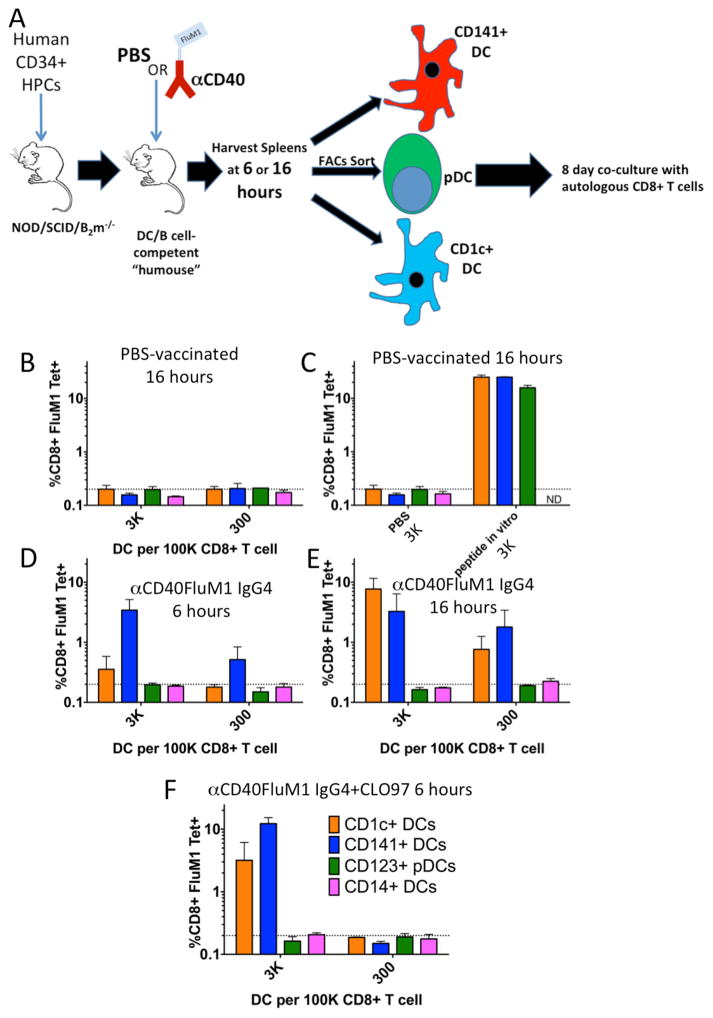
Figure 4. Antigen presentation by human DC subsets after antigen targeting in vivo.
(A) Cartoon illustrating the humanized mouse antigen cross presentation assay. (B–F) Graphical representations of FluM1-specific CD8+ T-cell responses generated by purified human DCs (Supplemental Figure 2) isolated from groups of HM-T vaccinated with (B) PBS for 16 hours, (C) purified human DC from PBS vaccinated mice pulsed with 1μM FluM1 epitope peptide for 1 hour in vitro prior to co-culture (D) αCD40-FluM1 IgG4 for six hours (10μg/mouse IV), (E) αCD40-FluM1 IgG4 for 16 hours (10μg/mouse IV), or (F) αCD40-FluM1 IgG4 (10μg/mouse IV) and CLO97 (20μg/mouse IV, mixed with αCD40-FluM1 IgG4) for six hours. DC-CD8+ T-cell co-cultures were performed as in Figure 1F. Orange bars indicate responses mediated by CD1c+ DCs, blue bars by CD141+ DCs, green bars by CD123+ pDCs, and pink bars by CD14+ DC. Data is representative of three experiments using two different human donors.

