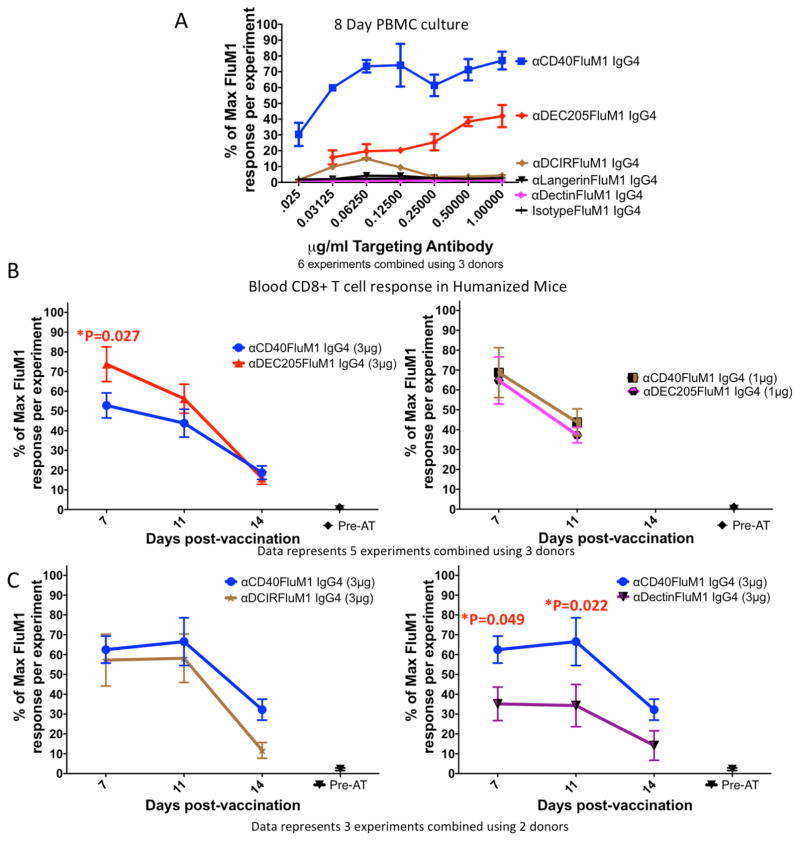
Figure 5. Comparisons of different antigen-targeting vaccines in vitro and in vivo.
(A) FluM1-specific CD8+ T-cell responses in human PBMC cultures performed as in Figures 1B–E. FluM1-specific CD8+ T-cell responses mediated by αCD40-FluM1 IgG4 are in blue, αDEC205-FluM1 IgG4 in red, αDCIR-FluM1 in magenta, and αDCIR-FluM1 IgG4 in brown. Black lines indicate responses by FluM1 containing antibodies directed against Langerin or a non-targeted isotype control FluM1 antibody. All antibodies were titrated 1:2 starting at a concentration of 1μg/ml. Error bars indicate replicates across six experiments using three separate human donors. To normalize data across multiple experiments and donors, every data point was configured as a percentage of the highest response in the corresponding experiment according to the following formula: % of maximum FluM1 response per experiment = (response of replicate “X”/replicate with max response in experiment)*100. (B–C) Mice were vaccinated IV and FluM1-specific CD8+ T-cell responses measured from blood as in Figure 3. Responses were then normalized and compiled as in Figure 5A. (B) Mice were vaccinated with either 3 or 1μg doses of αDEC205-FluM1 IgG4 or αCD40-FluM1 IgG4. (B) represents normalized data in graphical form (mean and SEM) of five experiments using a total of 30 HM-T mice (15 vaccinated with αCD40-FluM1 IgG4, 15 with αDEC205-FluM1 IgG4) constructed from three donors. (C) Represents normalized data (as in 5B) from three separate experiments using two different donors (20 HM-T mice total, 8 vaccinated with αCD40-FluM1 IgG4, 6 with αDCIR-FluM1 IgG4, and 6 with αDectin-FluM1 IgG4). Mice were vaccinated with 3μg αDCIR-FluM1 IgG4, 3μg αDectin-FluM1 IgG4, or 3μg αCD40-FluM1 IgG4. For experiments in this figure, a single dot triangle, hexagon, square or star represents one vaccinated humanized mouse. “Pre-AT” means the frequency of FluM1-specific CD8+ T cells from human donors at the time of adoptive transfer one day before vaccination. To account for the repeated measures of the longitudinal studies presented in Figure 5B and 5C, a Linear Mixed Model analysis was performed. Vaccine-induced responses induced at different time points were compared using PROC MIXED in SAS, using REPEATED statement. As fixed effects, we included treatment (vaccines) and day, and treatment-day interaction. A covariance structure of SP (POW) was used to account for the fact that responses from the same mice are more correlated for adjacent time points and correlation decreases with increasing distance between time points. P<0.05 is a statistically significant difference.

