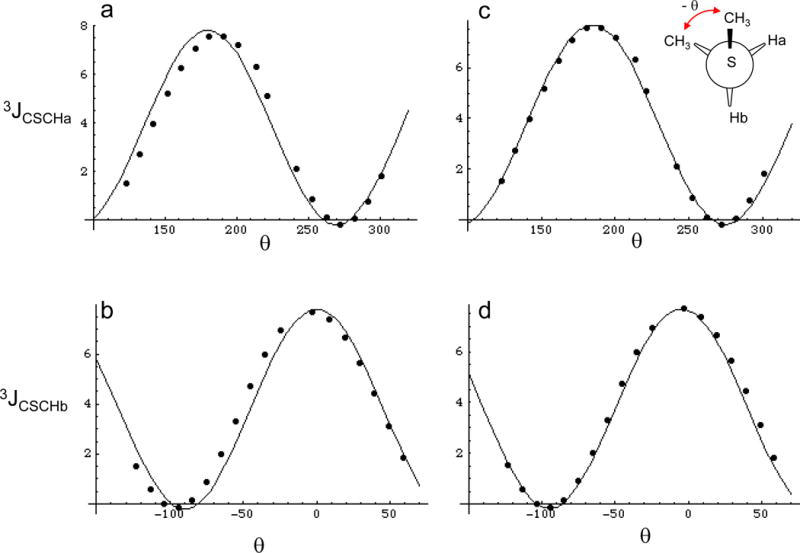
Figure 2.

Conformational dependence of 3JCSCH. Panels a and b show the calculated coupling constants at discrete values represnted by the closed circles, and the Karplus relations that best fit the data for 3JCSCHa and 3JCSCHb. Panels c and d were fit using equation 6, where the - value corresponds to Ha and the + value to Hb. 360° was added to negative values of θ in order to make the data cover a continuous range, however the resulting Karplus relations are not altered by this procedure.
