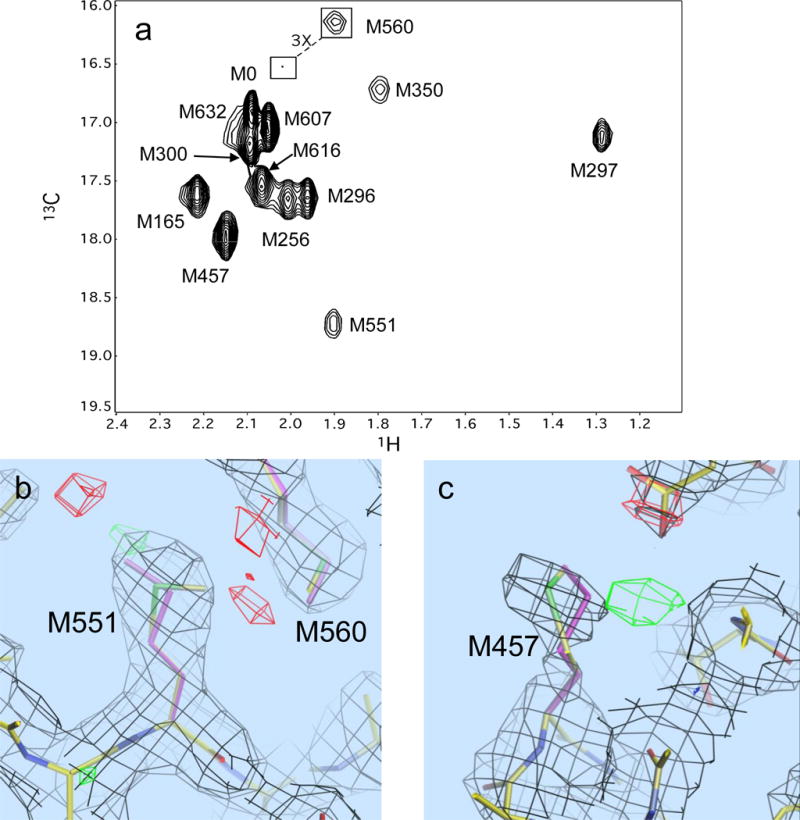
Figure 8.

Behavior of the methionine resonances of [methyl-13C]methionine in UvrB from B. caldotenax. Panel a shows the 1H-13C HSQC spectrum with assigned methionine resonances; panel b shows the electron density near M551 of chain B, the originally selected methionine rotamer (green and yellow), and the revised conformation (purple); panel c shows the electron density for M457, the original conformation (green and yellow), and the optimal single rotamer (purple). The inadequacy of the original conformation is indicated by the region in green. For M457, the best fitting single rotamer (purple) provides a poorer fit to the density than a mixture of rotamers (not shown). The red and green polygons correspond to regions of excessive and insufficient electron density predicted by the original conformational selection.
