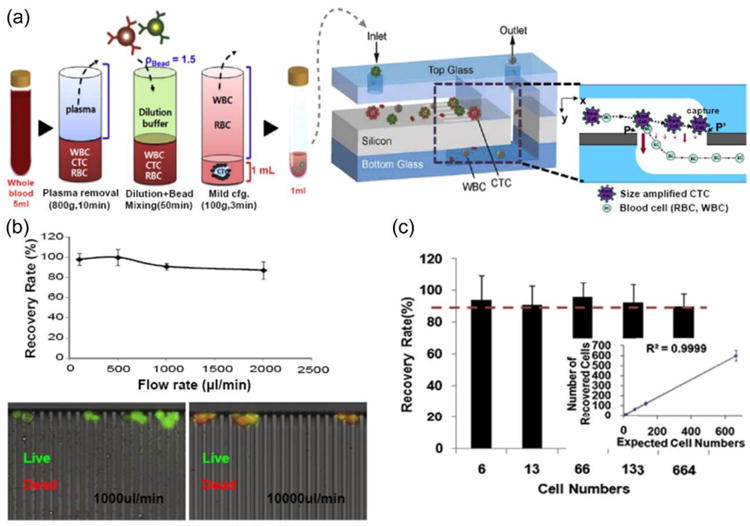
Figure 8.

(a) Schematic illustration of CTC isolation principle using an automated platform based on antibody capture and size exclusion filtration. A density-based CTC enrichment method removes hematopoietic cells easily prior to introduction into the microchip filter device (left). Microchip filter device incorporates slit arrays and 3-dimensional flow with enlarged cross-sectional view around the slit (right). (b) Recovery rate as a function of input flow rate between 0.1 and 2 mL/min (top). Cell viability test after isolation of cancer cells, with green fluorescence indicating viable cells (bottom). (c) Recovery rate vs. input cell number. Reproduced from reference 40 with permission from Elsevier Ltd, copyright 2014.
