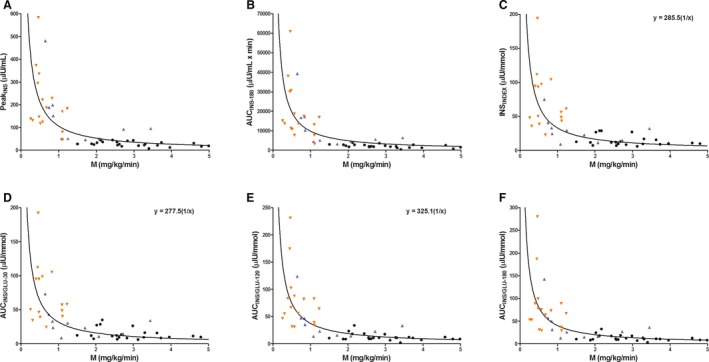
Figure 1.

Scatter plots of individual horse data (n = 49) showing the relationship between oral sugar test derived indices of β‐cell response: PeakINS (A), AUCINS ‐180 (B), INSINDEX (C), AUCINS / GLU ‐30 (D), AUCINS / GLU ‐120 (E), and AUCINS / GLU ‐180 (F) versus the mean insulin‐dependent glucose disposal rate (M), in horses with normal insulin regulation (NIR, black circle) and insulin dysregulation (ID with previous history of laminitis, orange downward pointing triangle; ID without previous history of laminitis, blue upward pointing triangle). A solid line (line of best fit) represents a rectangular hyperbolic curve fitted to the data. The curve is based on the function (y = constant × 1/x), where the constant = disposition index. Data that fulfill the statistical criteria of a rectangular hyperbolic curve have the equation in the figure (C, D and E). Three of the horses had a delayed early glucose and/or insulin responses during OST, resulting in missing data for INSINDEX and AUCINS / GLU ‐30.
