
Figure 3.
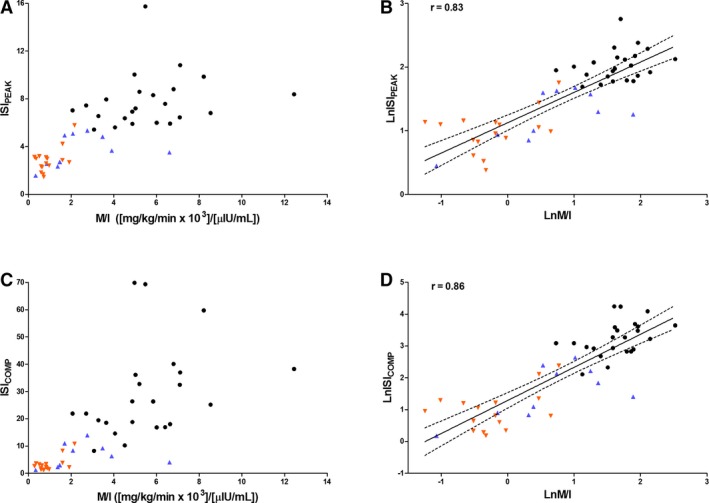
Scatter plots showing the relationship between the oral sugar test derived insulin sensitivity indices: ISIPEAK (A, B) and ISICOMP (C, D) and the mean insulin‐dependent glucose disposal rate per unit of insulin (M/I) calculated from the euglycemic hyperinsulinemic clamp, on the original scale (A, C) and after log‐transformation (B, D), in horses with normal insulin regulation (NIR, black circle) and insulin dysregulation (ID with previous history of laminitis, orange downward pointing triangle; ID without previous history of laminitis, blue upward pointing triangle). The solid line is the regression line (line of best fit), and the dashed lines are 95% CI of the best fit (CI for the mean response).