
Figure 4.
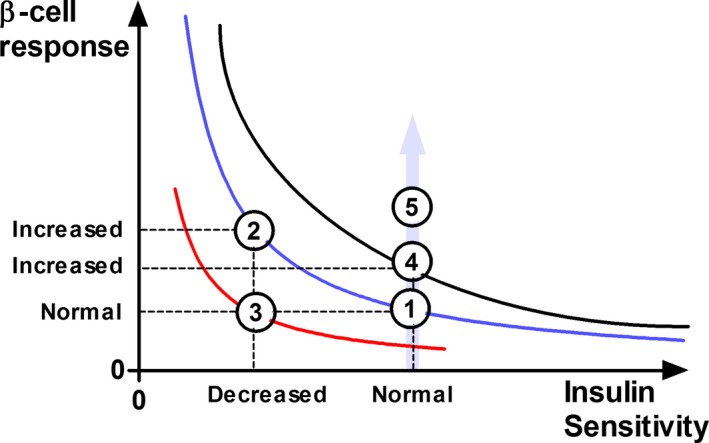
Schematic diagram illustrating the characteristics of the hyperbolic relationship between β‐cell response and insulin sensitivity (IS) and the product of the 2 parameters, the disposition index (DI). State 1: A horse with normal IS and normal β‐cell response. State 2: The horse compensates for decreased IS by increasing β‐cell responsivity, and the DI is unchanged compared to state 1 (ie, remains on the same hyperbolic curve). State 3: The horse fails to compensate for the decreased IS, the β‐cell response remains normal while the DI is decreased (a deviation of the hyperbolic curve toward origin). State 4: The horse develops an increased β‐cell response with a delayed adaptive decrease in IS (a deviation of the hyperbolic curve farer from origin; increased DI). State 5: The horse develops hyperinsulinemia without an adaptive decrease in IS. The IS is unchanged but the hyperinsulinemia is increased and follows the direction of the gray arrow. The horse will develop hypoglycemia when the increased β‐cell response reaches a certain level because there is no adaptive decrease in IS. In state 2, the glucose tolerance remains normal due to the adequate compensatory increase in β‐cell response. State 3 illustrates a typical response for a horse with impaired glucose tolerance and type 2 diabetes mellitus.