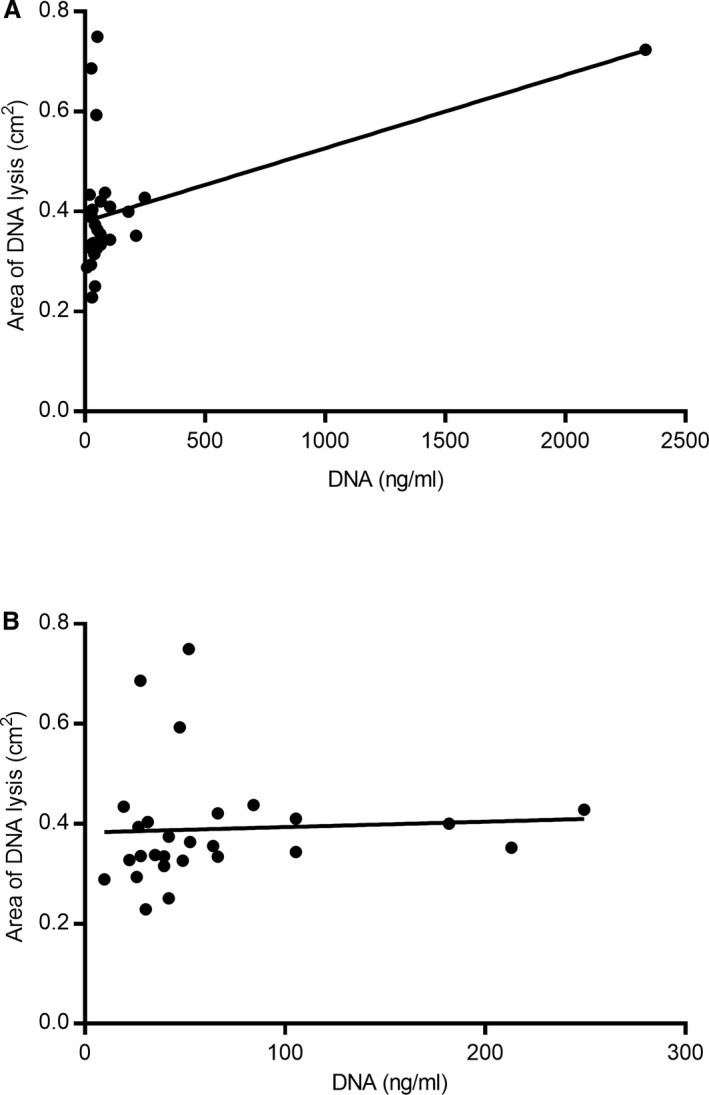
Figure 3.

Correlation between cell‐free DNA concentration and area of DNA lysis. (A) Initial analysis suggested there was a positive correlation between cell‐free DNA concentration and DNase activity measured by area of lysis (Spearman's ρ 0.38; P = 0.045). However, this was largely the result of a single outlier. (B) Re‐analysis after exclusion of the outlier found no evidence of a correlation between the two parameters (P = 0.11).
