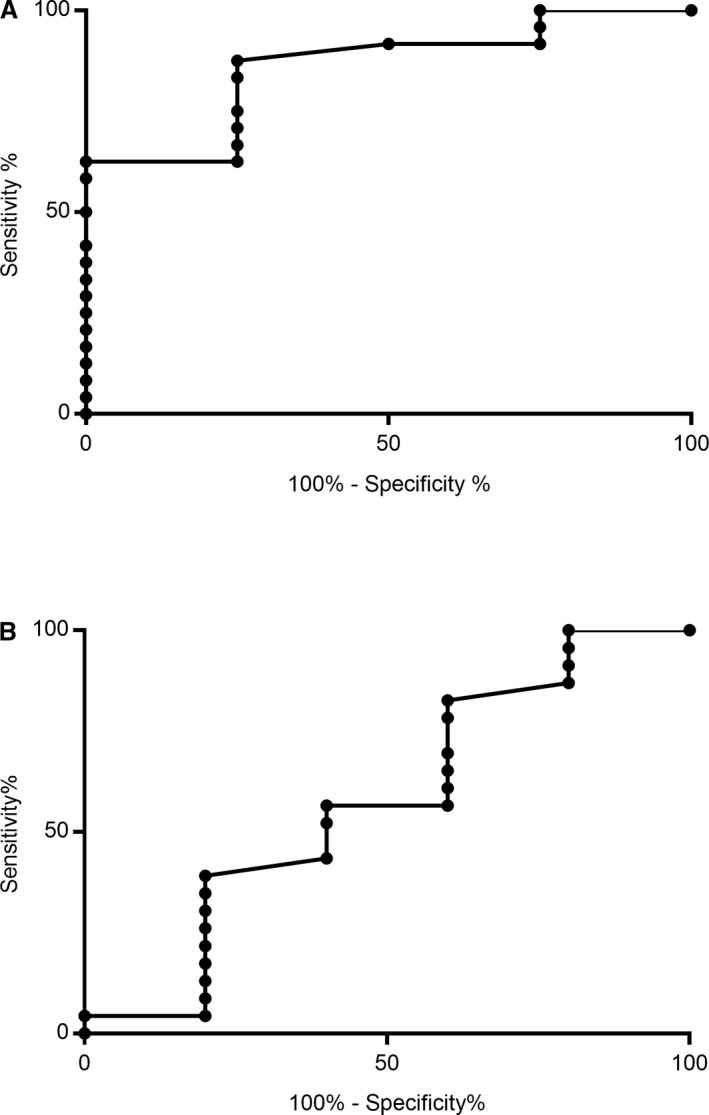
Figure 4.

ROC curve analysis for cell‐free DNA as a predictive marker for death (A) or thrombosis (B). Area under the ROC curve was significantly greater than 0.5 for the ability of cell‐free DNA to predict death/euthanasia by day 14 postadmission (four died/euthanized; 24 survived; P = 0.02); but was not significantly different from 0.5 for prediction of confirmed or suspected thrombotic events (five affected; 23 unaffected; P = 0.61).
