
Figure 3.
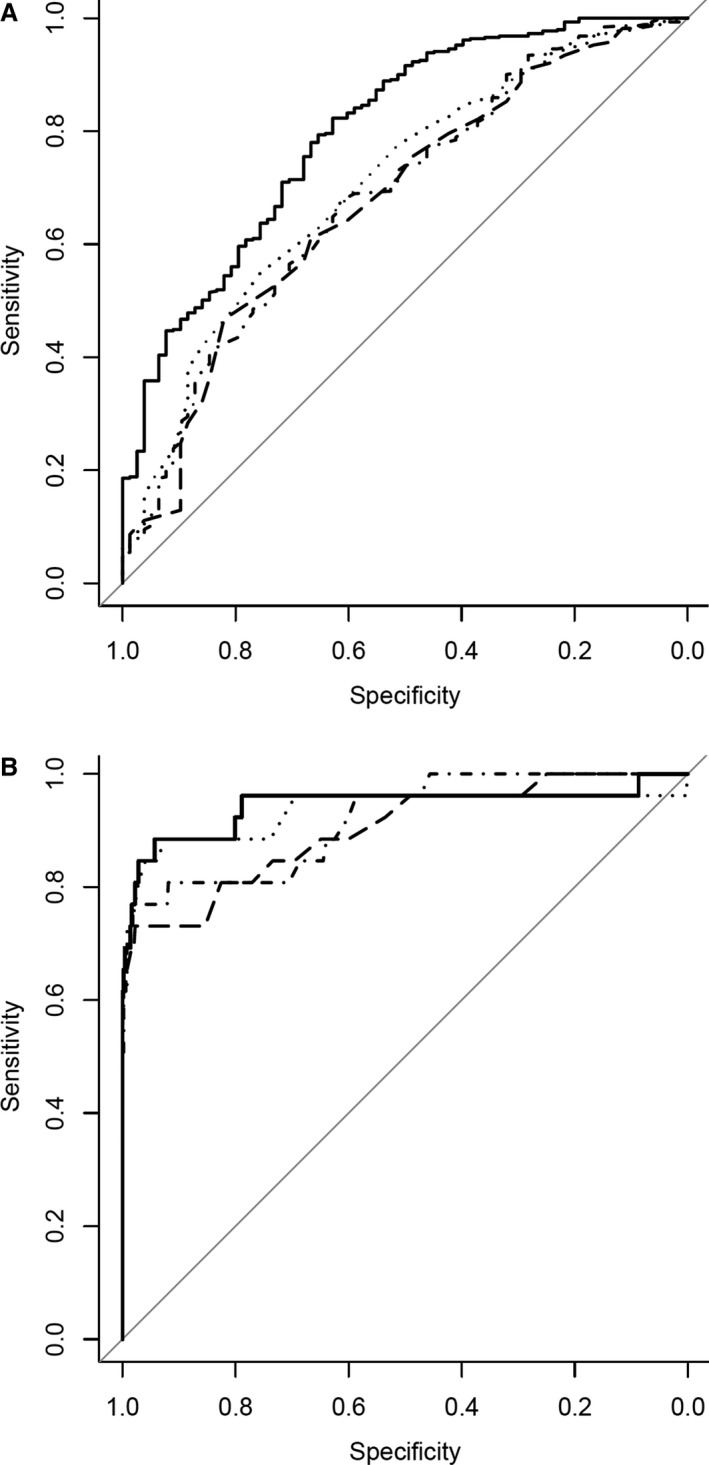
Receiver operator characteristic curves illustrating the overall diagnostic performance of predicted ionized calcium (solid line), total calcium (dashed line), total calcium corrected with albumin (dotted line), and total calcium corrected with total protein (dash‐and‐dot line), for hypocalcemia (A) and hypercalcemia (B).