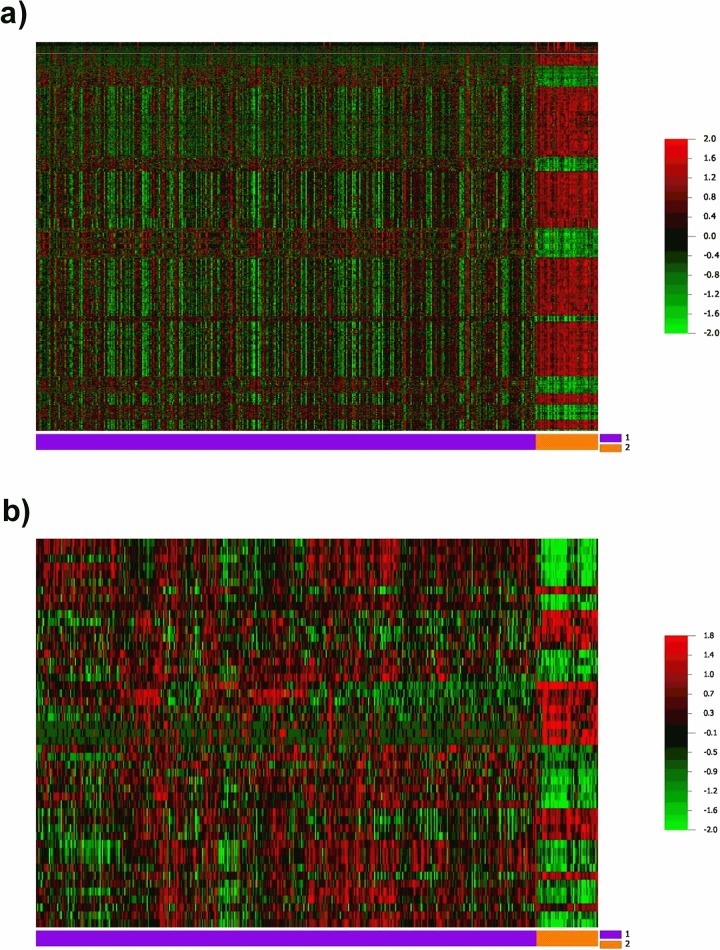
Fig 1. Heatmap showing gene and miRNA differential expression in tumor tissue samples (1: purple) compared with surrounding normal tissues (2: orange) from TCGA data.
a Global gene expression analysis revealed 2,267 differentially expressed genes (P ≤ 0.001 and FDR ≤ 0.001); b miRNA expression analysis revealed 49 miRNAs differentially expressed (P ≤ 0.001 and FDR ≤ 0.001). Each line in the left axis represents a gene/miRNA. Columns represent each sample.

