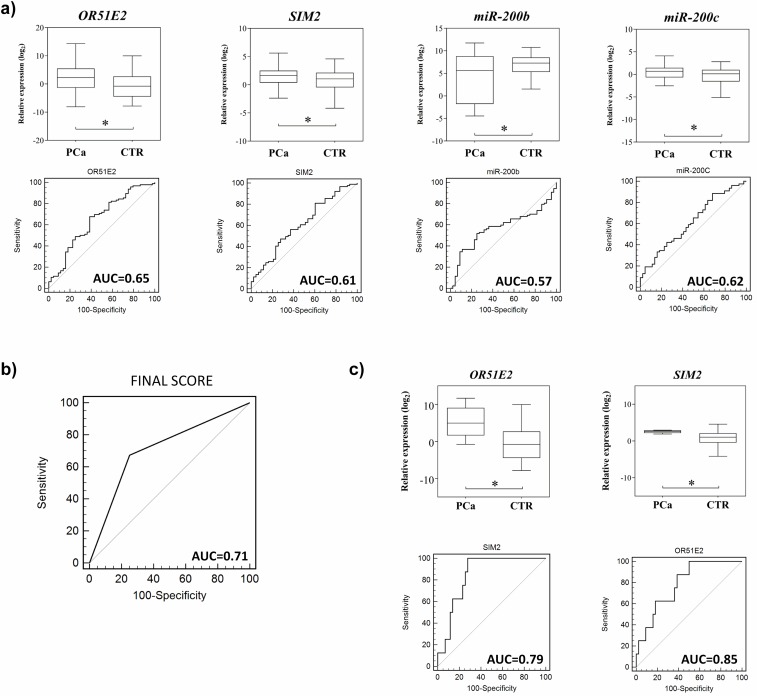
Fig 3. Differential expression of circulating mRNAs and miRNAs in plasma samples from patients with PCa and CTR and their respective ROC curves.
a Expression analysis of patients versus controls. b Differential expression of SIM2 and OR51E2 genes in plasma samples from patients versus controls, both with PSA level ≤ 4.0 ng/mL and their respective ROC curves. c ROC curve referring to the score developed from the following transcripts: miR-200c, miR-200b, OR51E2, and SIM2 genes; sensitivity of 67%, specificity of 75%. ROC = receiver operating characteristic, PCa = prostate cancer, CTR = controls subjects, PSA = prostate-specific antigen, AUC = area under the curve. *Statistically significant difference (Student’s t-test P < 0.05).

