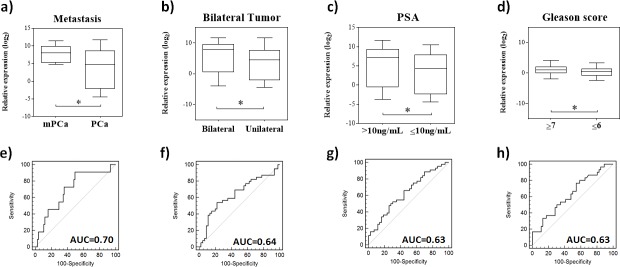
Fig 4. Comparison between circulating miR-200b expression levels and clinic-pathological features.
The superior line represents the miR200b expression according to the: a. presence or absence of metastasis; b. unilateral or bilateral tumors; c. Low or high PSA levels; and, d. Gleason score ≤ 6 or ≥ 7. e-h. The ROC (Receiver Operating Characteristic) curve analysis for each histopathological feature. PCa = prostate cancer; mPCa = metastatic prostate cancer; AUC = area under the curve. *Statistically significant (Student’s t-test P < 0.05).

