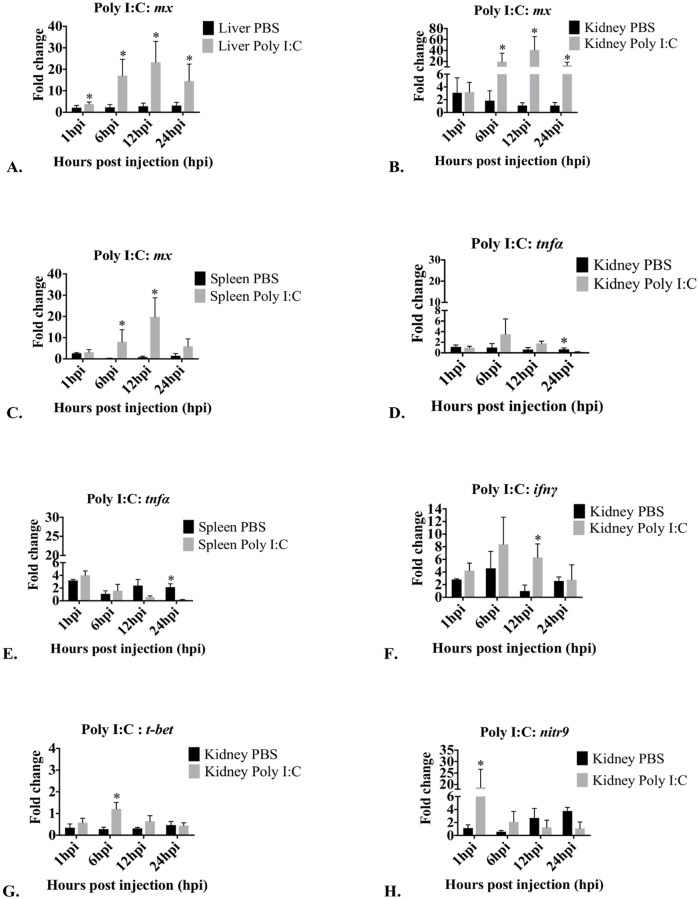
Fig 6. Graphs depicting changes in mRNA expression over time of mx, tnfα, ifnγ, t-bet and nitr9 in liver, kidney and spleen after treatment with Poly I:C.
Only tissues and genes that demonstrated significant changes in expression compared to PBS injected controls are presented. Fold changes in mx in liver (A), kidney (B) and spleen (C), tnfα in kidney (D) and spleen (E), ifnγ in kidney (F), t-bet in kidney (G) and nitr9 in kidney (H) are presented as mean fold change relative to the time zero group ± standard deviation as measured by quantitative RT-PCR. Arp was used as a housekeeping gene. hpi = hours post injection; control = PBS (endotoxin-free); Treated = Poly I:C. *Significant (p<0.05) difference in expression of treated compared to control. No significant changes in expression were observed in tnfα in liver, in ifnγ, t-bet and in nitr9 in liver and spleen (S1 Table).

