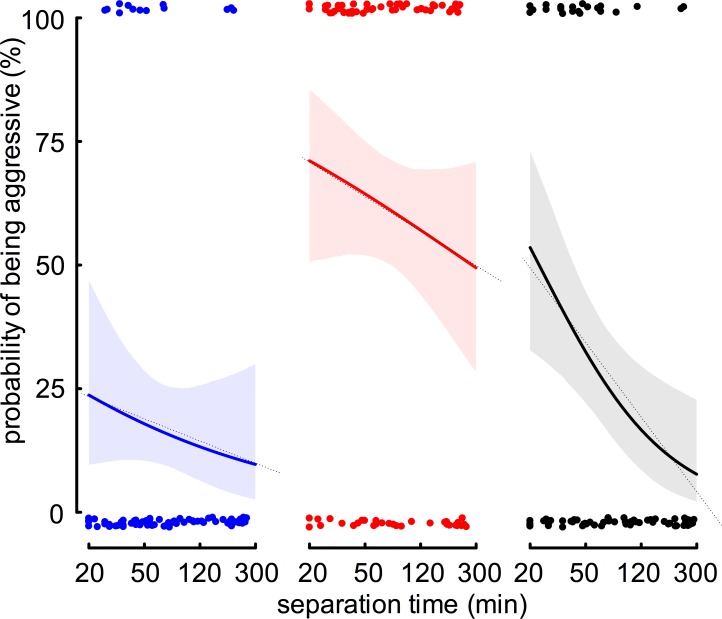
Fig 4. Effect of separation time (min) on probability of being aggressive.
Social-FW differ with high certainty (>99.9%) in their probability of being aggressive at short separation time (20 min), depending on the type of encounter ant (vs NM in blue: 24% and vs NNM in red: 71%). The change in odds decreases with increasing separation time, and this decrease is only significant for isolated-FW (vs NNM in black: -62%). Dots represent binary, independent data of focal-workers that were classified either as being aggressive (upper) or non-aggressive (lower). Solid lines represent fitted values from the binomial GLM (model IIIA) and shaded areas represent the 95% credible interval (based on Bayesian statistics). Dotted lines are linear regressions on log-transformed separation times (model lllB).

