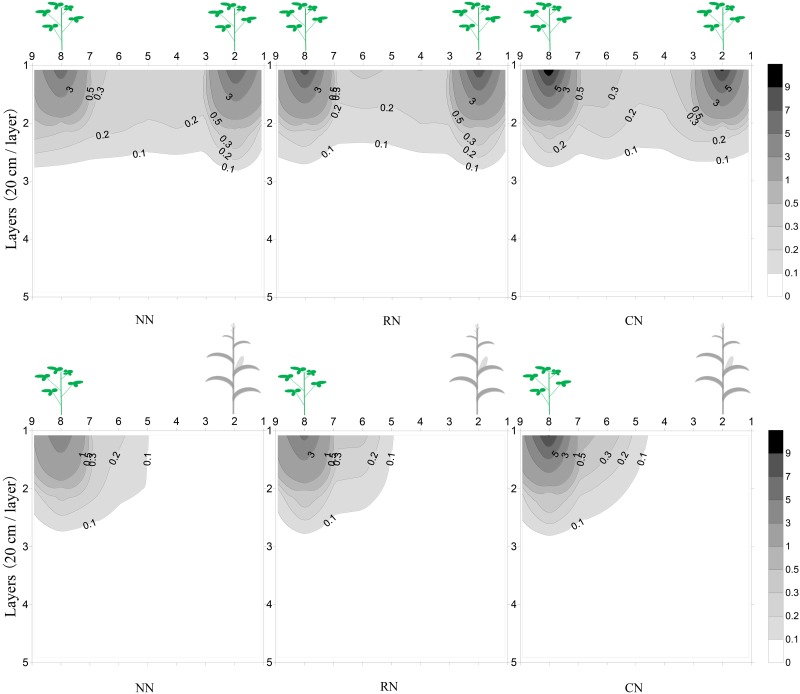
Fig 5. Effect of different below-ground interactions and N application rates on soybean root distribution at the R2 stage of development in 2014.
MS with different N application rates (A), IS with different N application rates (B), the coordinate axis and N application rates were same as Fig 4.

