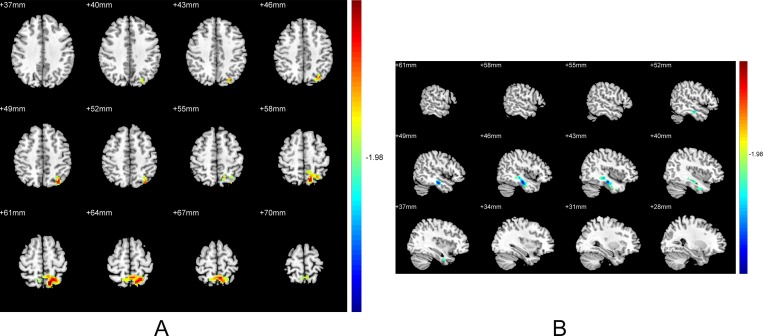
Fig 4. Brain regions showing the ReHo abnormalities in patients with EOD compared with LOD.
(A) Relative to patients with LOD, the ReHo increased in left precuneus in patients with EOD (p<0.05, uncorrected). (B) Relative to patients with LOD, the ReHo decreased in right fusiform in patients with EOD (p<0.05, uncorrected). Red color: significant increased ReHo. Blue color: significant decreased ReHo

