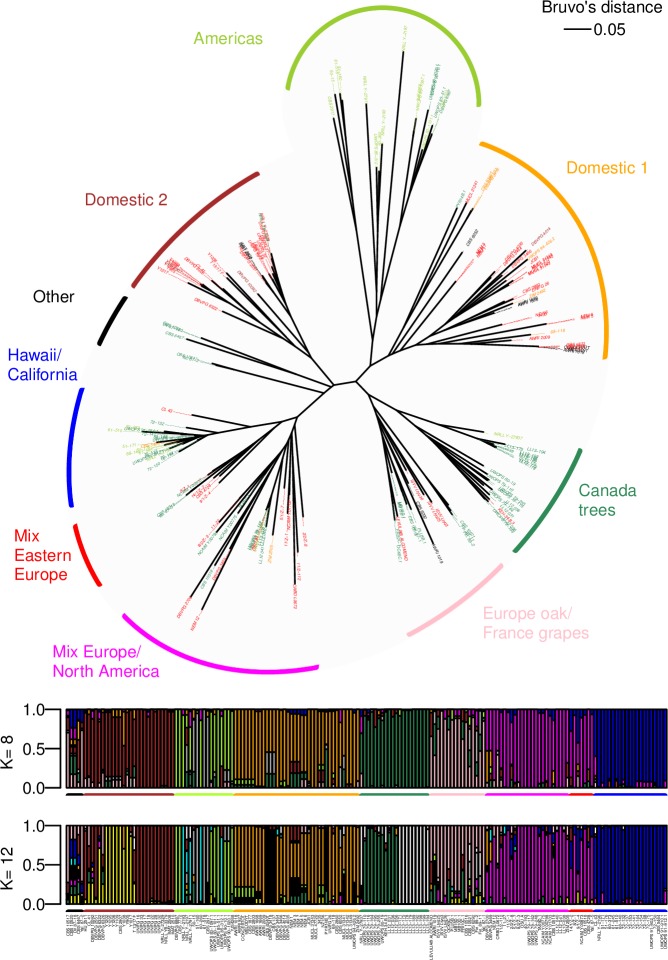
Fig 2. Genetic relationships between 172 L. thermotolerans isolates determined using 14 microsatellite makers.
Colour-coding of isolates corresponds to isolation substrate, as per Fig 1. (A) Dendrogram constructed using Bruvo’s distance and NJ clustering. (B) Barplot representing population structure (K = 8 and K = 12). The posterior probability (y-axis) of assignment of each isolate (vertical bar) to inferred ancestral populations is shown with different colours.

