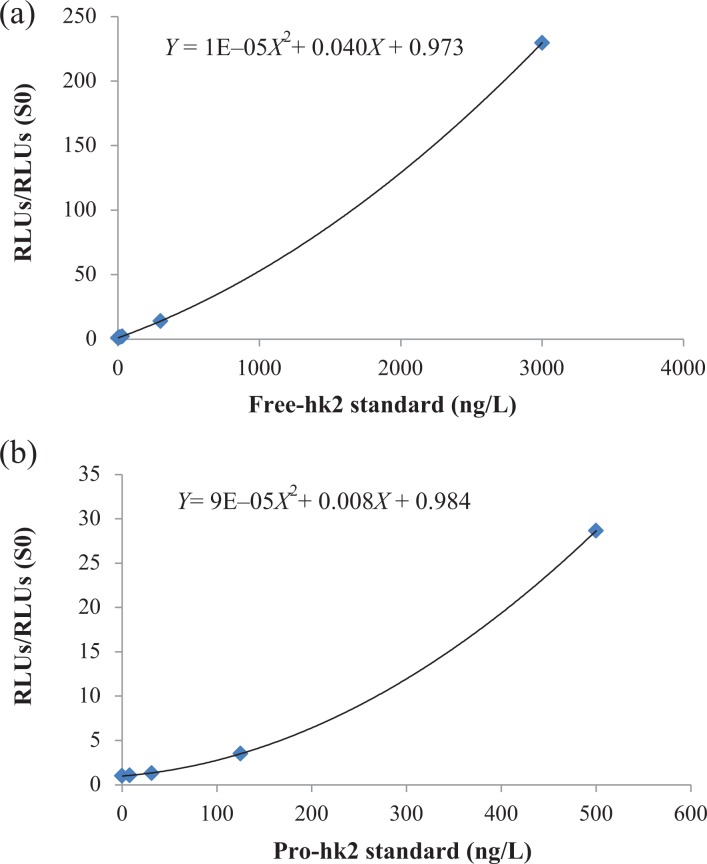
Figure 1.
Average calibration curves for the free-hK2 (a) and pro-hK2 (b) ACCESS 2 research assays. The assays are calibrated with recombinant purified hK2 or pro-hK2. The y-axis represents the ratio of the RLU at various levels to the RLU for the zero calibrator. The solid lines represent the grade 2 polynomial regression curves. hK2: human kallikrein 2; RLU: relative light units.

