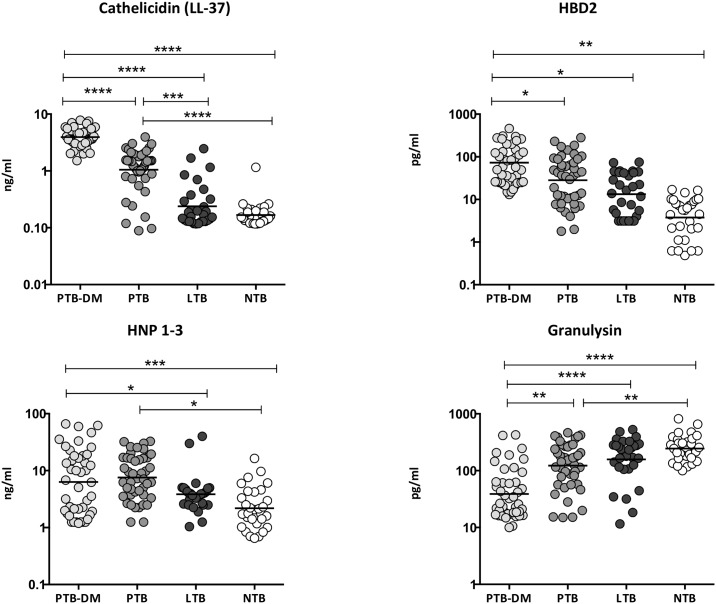
Fig 1. Elevated circulating levels of AMPs in PTB-DM and PTB individuals.
The plasma levels of cathelicidin (LL37), HBD2, HNP1-3 and granulysin were measured in PTB-DM (n = 44), PTB (n = 44), LTB (n = 30) and NTB (n = 30) individuals. The data are presented as scatter plots with each circle representing a single individual. P values were calculated using the Kruskal—Wallis test with Dunn’s post—hoc for multiple comparisons.

