
Fig 1. Comparison of TMS-evoked EEG potentials recorded from different cortical areas employing Local Mean Field Power (LMFP) and event-related spectral perturbation (ERSP).
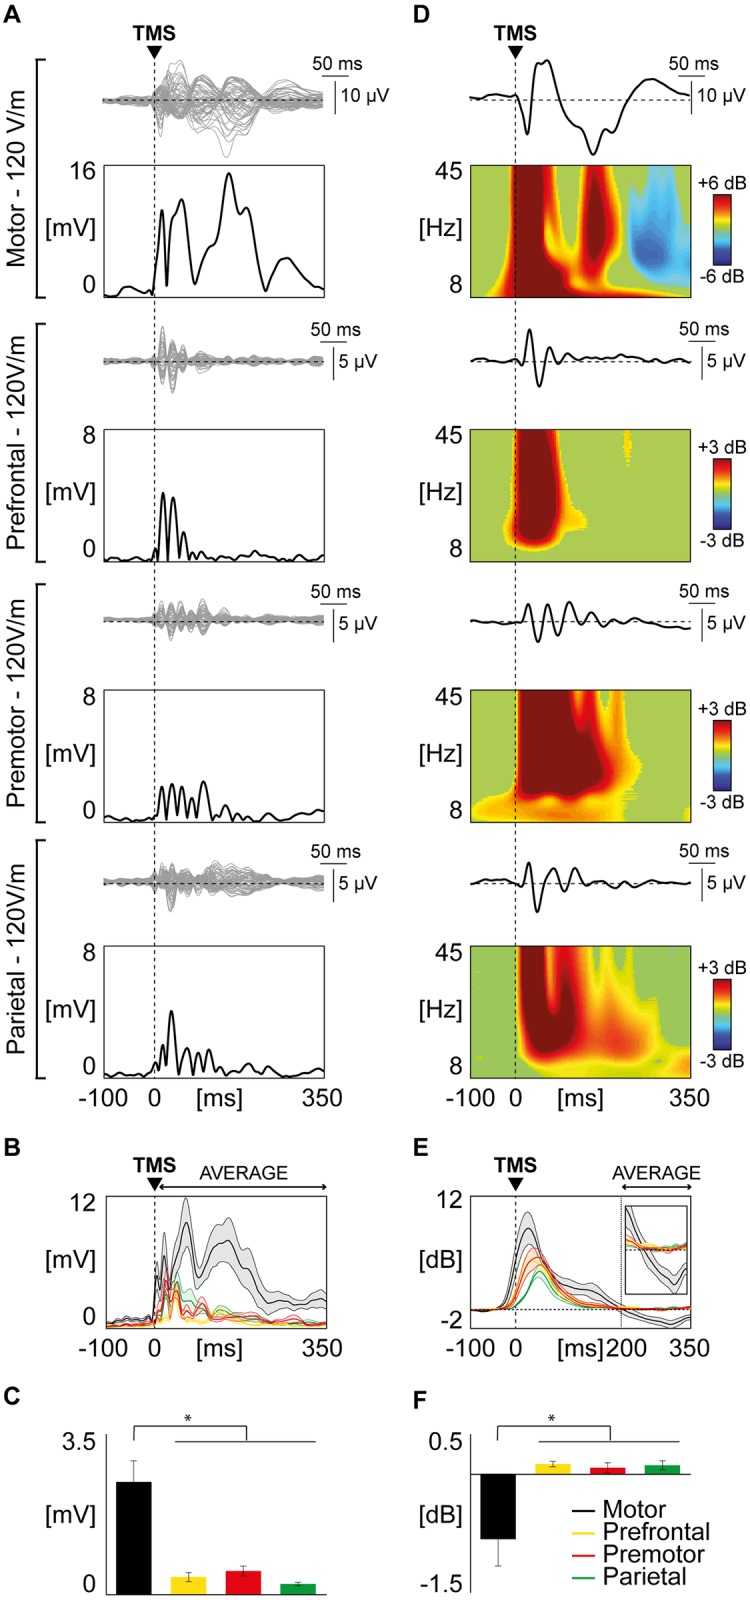
(A) For each stimulated area, TMS-evoked EEG responses are shown from one representative subject. Butterfly plots of all channels are displayed (top panels, grey traces), together with the corresponding LMFP (bottom panels, black traces). The dashed vertical line indicates the timing of the TMS pulse. (B) Grand-average of LMFP for each stimulated area. Thick traces indicate the grand-average LMFP across subjects (±SE, color-coded shaded regions). Responses recorded after the stimulation of different cortical areas are color coded as follows: motor in black, prefrontal in yellow, premotor in red, parietal in green. (C) For each stimulated area, the LMFP values averaged between 8 and 350 ms post-TMS are shown in the bar histogram (mean ± SE). Asterisks indicate statistically significant differences (* p<0.05, Wilcoxon signed rank test). Bars are color coded as in Panel B. (D) Black traces represent TMS-evoked EEG responses of a representative subject (same as in panel A) for one of the four channels closest to the stimulation site, with the corresponding ERSP shown below. A Wavelet Transform (Morlet, 3.5 cycles) has been applied at the single trial level. Significance threshold for bootstrap statistics is set at α < 0.01. Non-significant activity is set to zero (green), red colors indicate a significant increase with respect to the baseline, while blue colors indicate a significant reduction compared to the baseline. As in Panel A, the dashed vertical line indicates the time of the TMS pulse. (E) The averaged ERSP of the four channels located under the stimulation coil (between 8 and 45 Hz) is presented for each stimulated area (color coding as in panel B and C). Each thick line indicates the grand-average across subjects (± SE, color-coded shaded regions). The same traces are enlarged in the inset (time scale from 150 to 350 ms; power scale from -2 to 2 dB). The dashed vertical line indicates the average time in which the ERD occurs. (F) Using the same color coding as in panel B, C and E, bars indicate, for each stimulated area, the grand-average (±SE) of the averaged ERD (ERSP between 200 and 350 ms post-TMS). Asterisks indicate statistically significant differences (* p<0.05, Wilcoxon signed rank test).