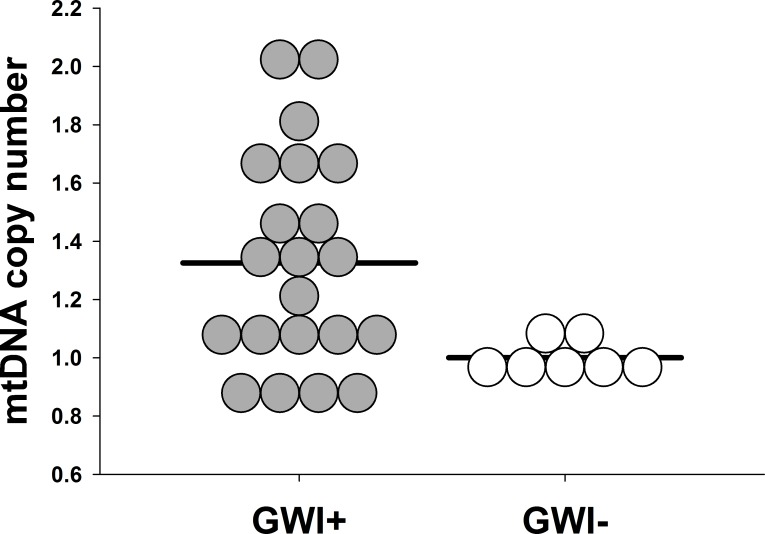
Fig 2. Mitochondrial content identified by QPCR analysis of blood for cases with (n = 21, GWI+) and without (n = 7, GWI-) Gulf War illness.
Dot density plot data represent mitochondrial content, as indexed by mtDNA copy number, in GWI+ cases and controls (GWI-). Greater mtDNA copy number was observed among cases with GWI+ relative to controls (p = 0.001, d = 1.69).

