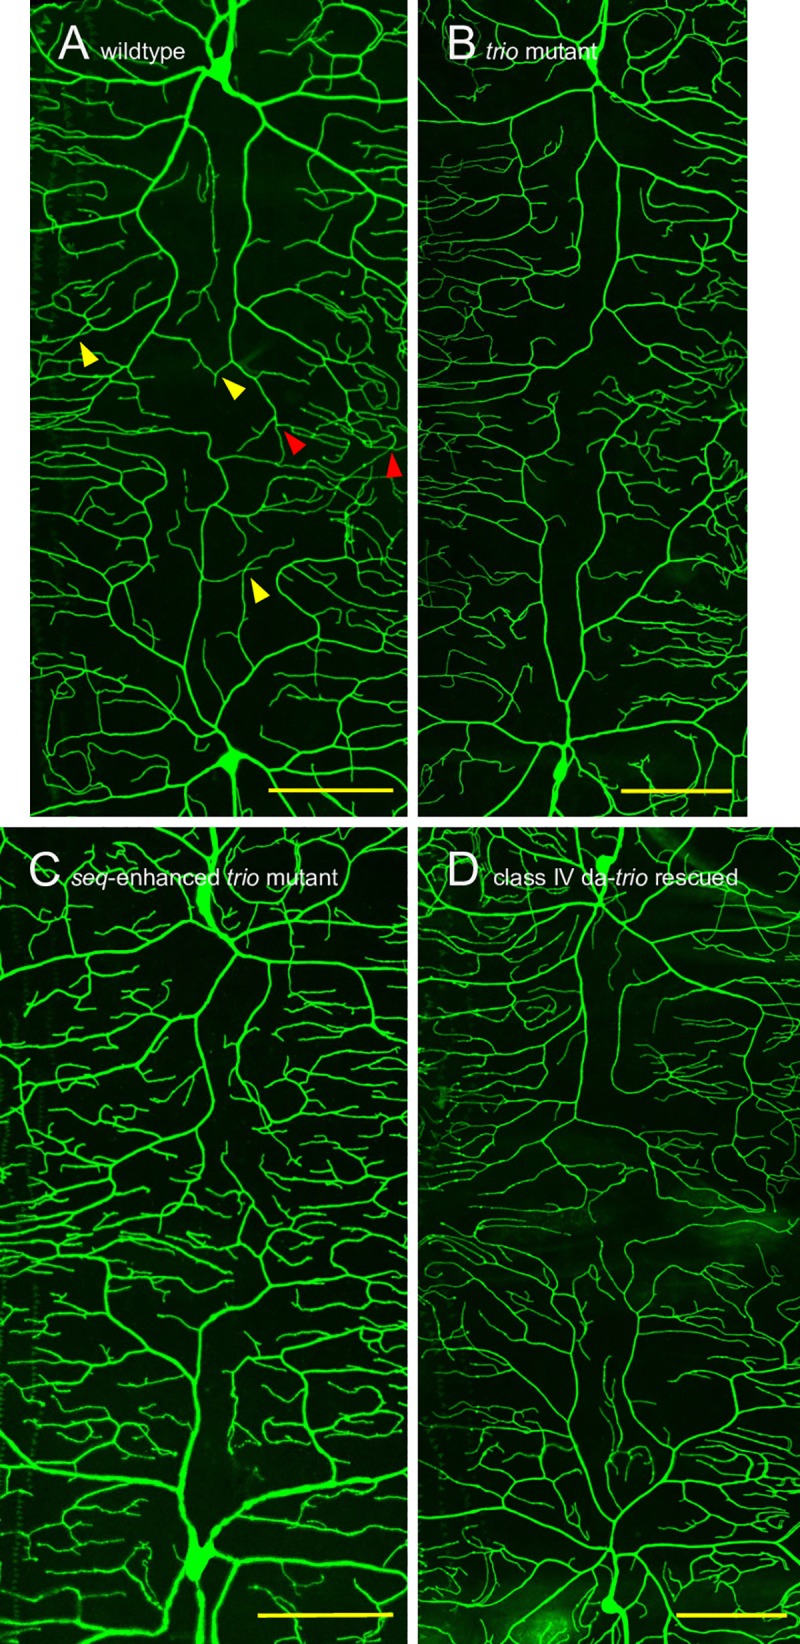
Fig 2. Representative ddaC morphologies in control, mutant and rescued third instar larvae.

(A) ddaC in wildtype larvae (GAL4-ppk1.9, UAS-mCD8GFP / +; trioM89 / +, image shown is 300.8 μm x 650.5μm). (B) ddaC in simple trio mutant larvae (GAL4-ppk1.9, UAS-mCD8GFP / +; trioM89 / trioP1, image shown is 302.8 μm x 749.8μm). (C) ddaC in seq-enhanced trio mutants (GAL4-ppk1.9, UAS-mCD8GFP / seq9.17; trioM89 / trioP1, image shown is 300.4 μm x 601.7μm). (D) ddaC in ppk1.9-trio rescued seq-enhanced trio mutant larvae (GAL4-ppk1.9, UAS-mCD8GFP / seq9.17; trioM89 / trioP1, UAS-trio.B, image shown is 351.1 μm x 751.2μm). The dorsal midline runs horizontally through the approximate center of each image. In (A) representative examples of iso-neuronal avoidance defects are indicated with yellow triangles while representative examples of hetero-neuronal tiling defects are indicated with red triangles. Scale bars show 100 μm.
