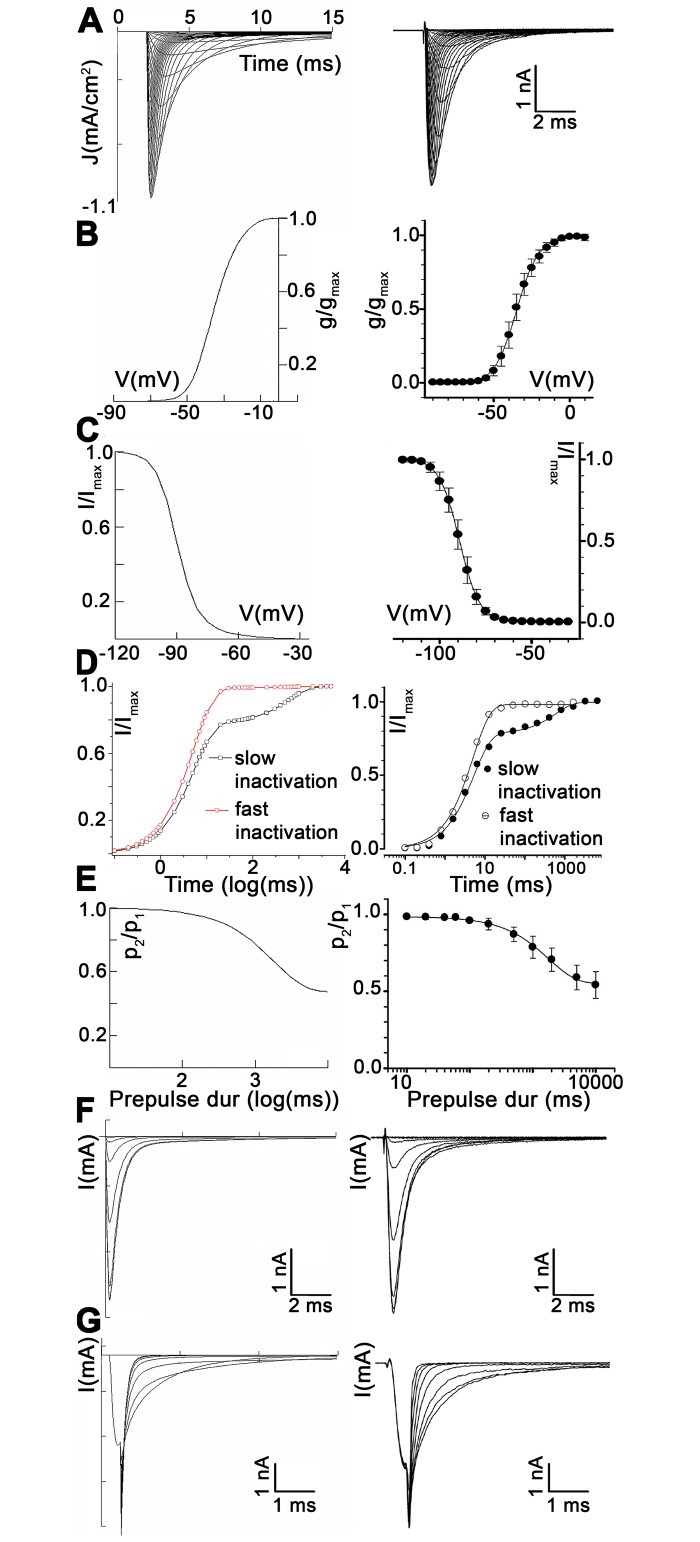
Fig 2. Comparison between experimental and modelled data in NaV1.5.
A: Voltage-clamp curves from -90 mV to 60 mV in steps of 5 mV. B: Voltage dependence of the normalized conductance. C: Steady-state availability during fast inactivation. D: Recovery from fast and slow inactivation. E: Development of slow inactivation. F: Availability curves. G: Deactivation curves. Left column: modelled data. Right column: experimental data. Experimental data reproduced from [27], under the terms of the Creative Commons Attribution License.

