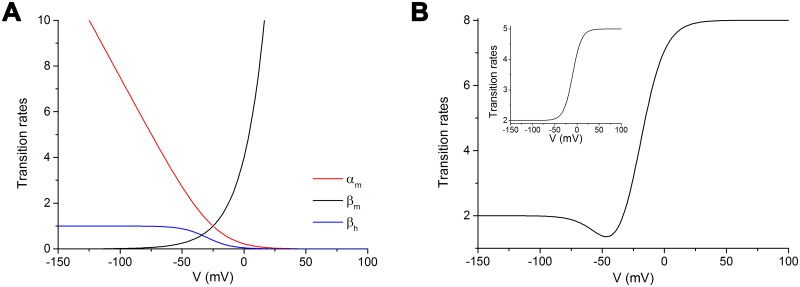
Fig 4. Different formal mathematical descriptions of transition rates.
A: Curves drawn from the original equations by Hodgkin and Huxley [3] for the sodium channel rate constants αm (red line), βm (similar also to αh) (black line), and βh (blue line). B: Modified sigmoid curve adopted in the present study (see text for details). Inset: Sigmoid curve with minimum and maximum asymptotes.

