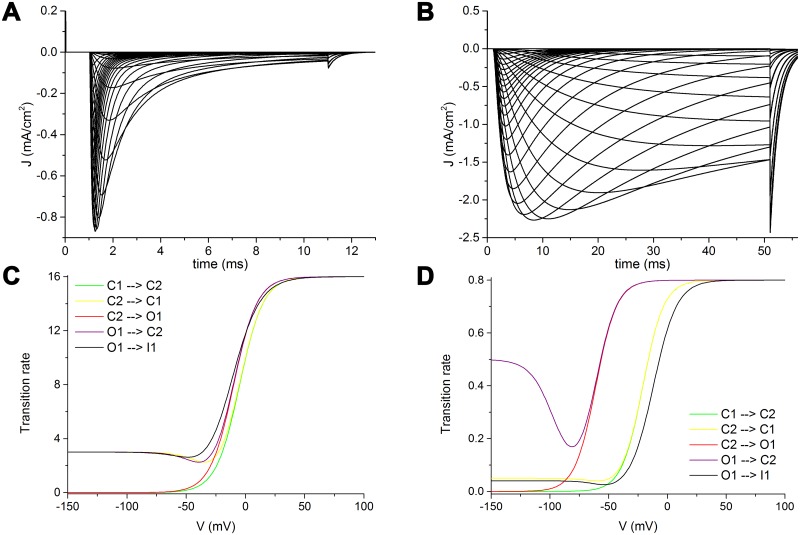
Fig 5. Features of activation sequence in NaV1.2 and NaV1.9.
Modelled NaV1.2 (A) and NaV1.9 (B) voltage-clamp curves from -80 mV to 70 mV in 5 mV increments, from a -120 mV holding potential. NaV1.2 (C) and NaV1.9 (D) transition rates dependence from voltage of the activation sequence (comprehensive of fast inactivation). Green: C1 to C2; yellow: C2 to C1; red: C2 to O1; purple: O1 to C2; black: O1 to I1.

