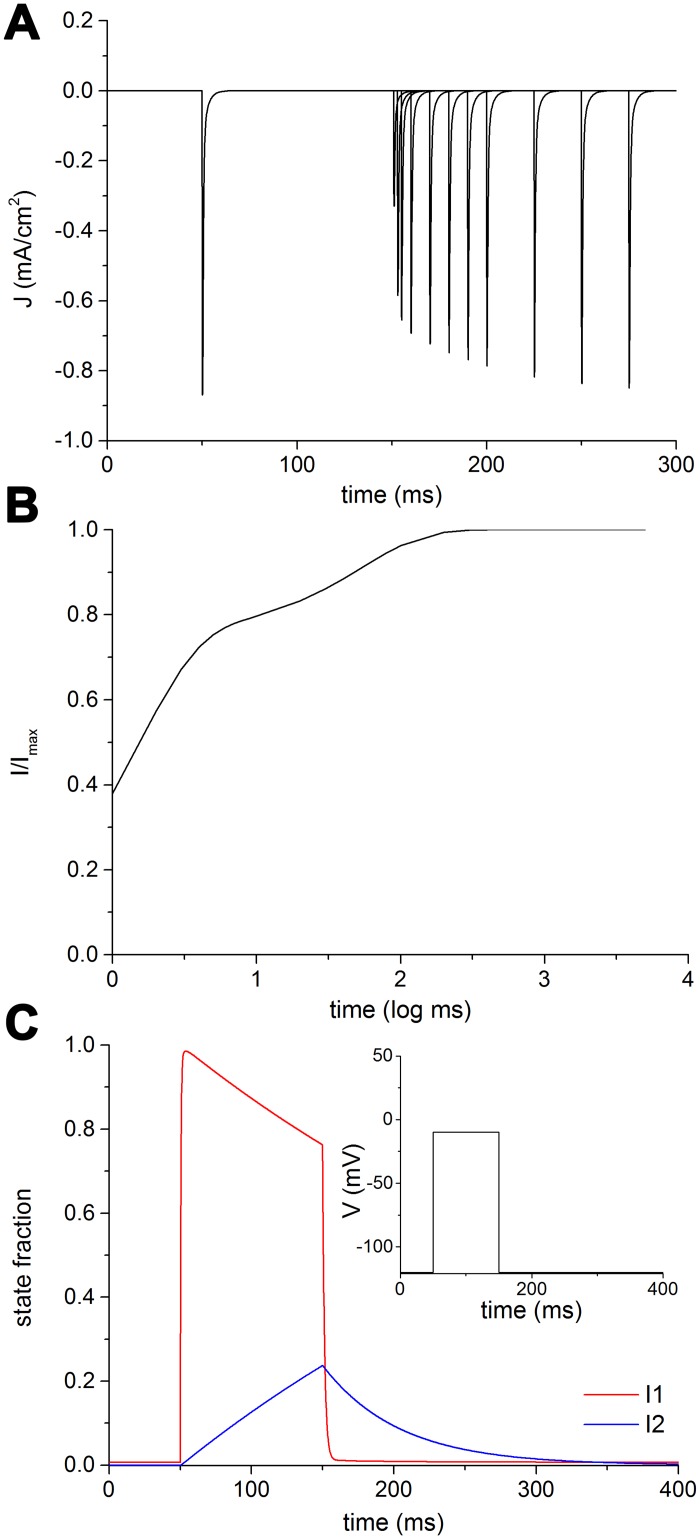
Fig 6. Recovery from inactivation in NaV1.2.
A: Superimposed simulated current traces recorded with increasing duration of repolarization interval. B: Time dependent fractional recovery curve from fast inactivation. C: Fraction of channels in the inactivated states I1 (red) or I2 (blue) as brought about by the repriming protocol depicted in the inset.

