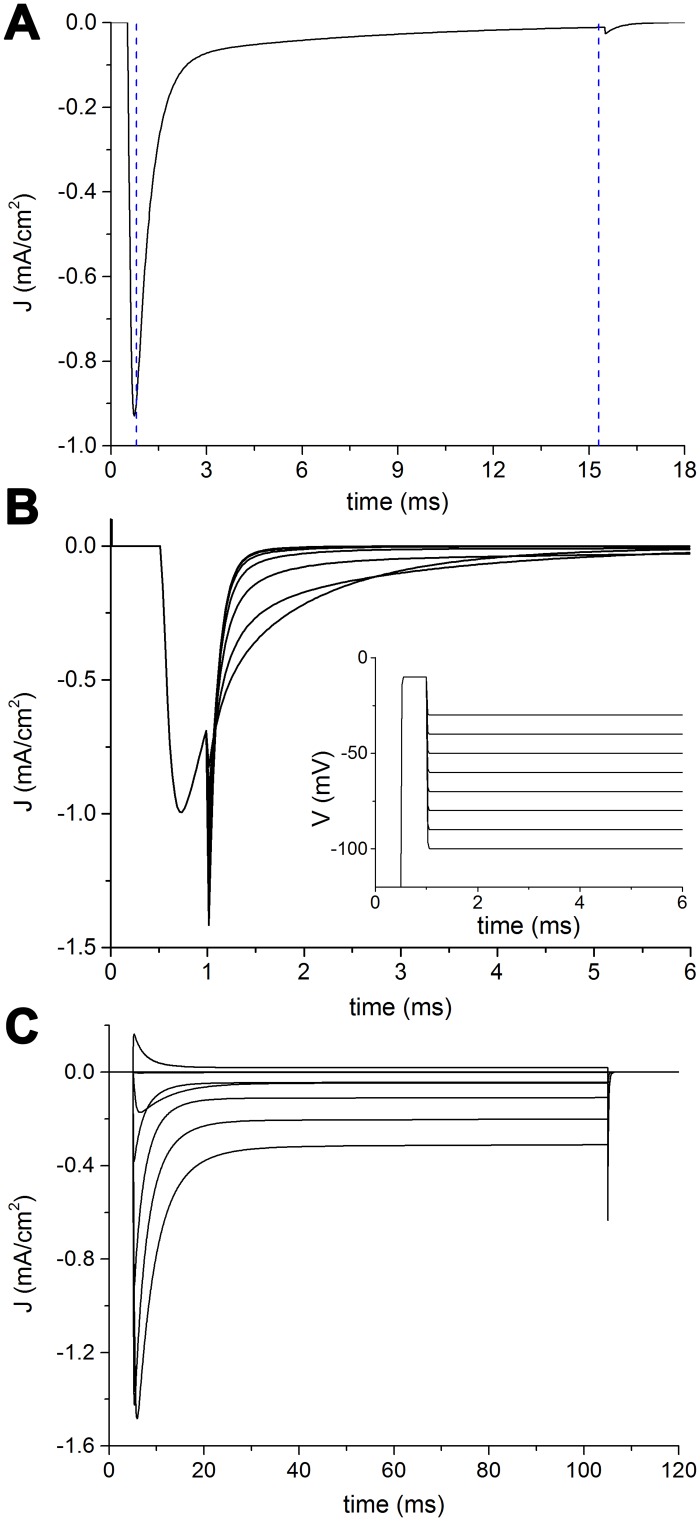
Fig 7. Other electrophysiological features.
A: Decay from peak of activation during a voltage-clamp of -10 mV in Nav 1.1 modelled channel. The curve between the two vertical blue lines has been fitted to a double exponential (see text for details). B: Simulated deactivation curves in NaV1.5 following the protocol depicted in the inset. C: Simulated persistent current in NaV1.6.

