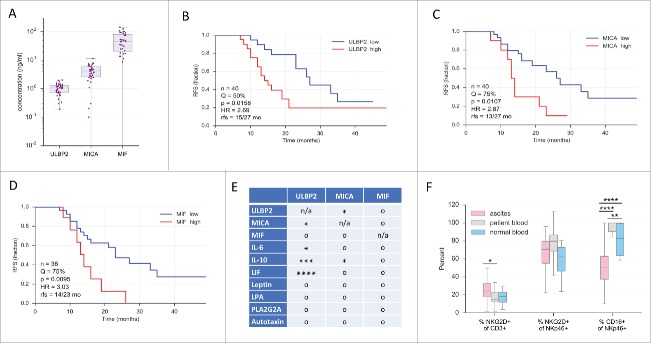
Figure 1.
Clinical significance of sULBP2, sMICA and MIF and in ovarian cancer ascites. (A) Concentrations of sULBP2, sMICA and MIF in ovarian cancer ascites (sample size: n = 36–40) as measured by ELISA. Boxes: upper and lower quartile with median; bars: 95% CI. (B-D) Kaplan-Meier plots of the data in panel 1A using data sets split at the median (Q = 50%) or the upper quartile (Q = 75%) as indicated. n: total sample size; p: logrank test p value; HR: hazard ratio; rfs: median RFS of “high” vs. “low” groups. (E) Probabilities of independent prognostic power of sULBP2, sMICA and MIF. For each variable, the best Kaplan-Maier split by log-rank test (panel B) was determined to discretize samples into 2 groups. Hypergeometric testing was used to determine significant overlaps between groups. *, ***, ****: p < 0.05, p < 0.001: p < 0.0001; o: not significant; n/a: not applicable. Significance indicates lack of independence. (F) Percentage of positive NKG2D and CD16 cells of the indicated lymphocyte subsets in ovarian cancer ascites, patient blood or blood from donors with non-malignant conditions (designated as “normal blood)” measured using flow cytometry. Statistical significance between samples was determined by unpaired t-test and is indicated by asterisks if p < 0.05. Gating strategy see Fig. S6.

