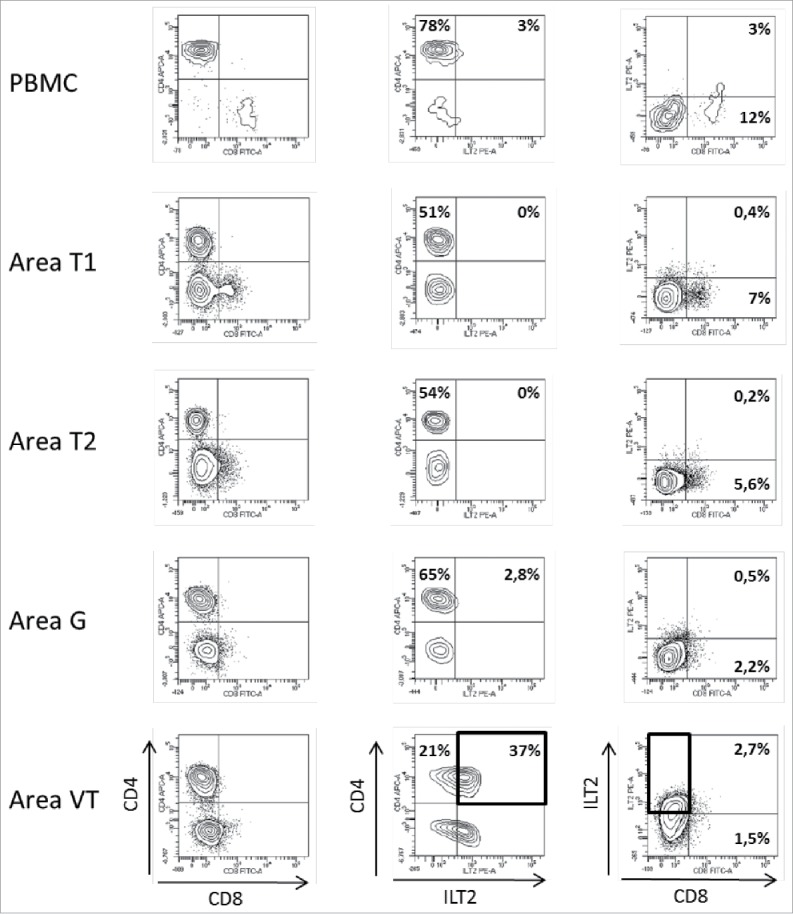
Figure 2.

Representative dot plots of the results obtained by flow cytometry analysis for ILT2 cell-surface expression on CD8+ and CD4+ T cells from PBMC and 4 different tumor areas in patient #8 are shown. Tumor-infiltrating cells were obtained after mechanic disruption followed by enzymatic digestion of 4 different areas from the surgically-resected tumor (T1, T2, G, VT). PBMC and tumor infiltrating cells from each tumor area were stained with conjugated-antibodies directed against CD3, CD4, CD8, and ILT2 and were then analyzed by flow cytometry. Percentages of both ILT2-positive and ILT2-negative populations gated on CD3+ T cells are indicated. G, metastatic hilar lymph node; VT, tumoral thrombus of the renal vein
