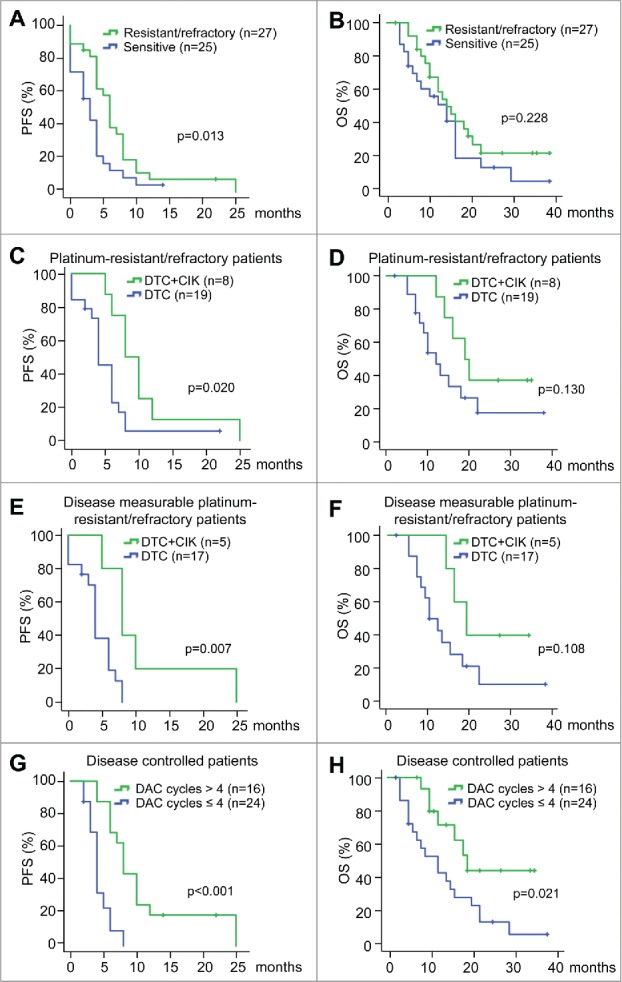
Figure 3.

Kaplan–Meier analysis of PFS and OS with different platinum sensitivity and treatments (A and B) Kaplan–Meier survival curves of progression-free survival (A) and overall survival (B) for the platinum-resistant/refractory patients and platinum-sensitive patients, using the log-rank test to evaluate significance. (C and D) Kaplan–Meier survival curves of progression-free survival (C) and overall survival (D) in platinum-resistant/refractory patients based on different treatments (DTC or DTC+CIK treatment), using the log-rank test to evaluate significance. (E and F) Kaplan–Meier survival curves of progression-free survival (E) and overall survival (F) in disease measurable platinum-resistant/refractory patients based on different treatments (DTC or DTC+CIK treatment), using the log-rank test to evaluate significance. (G and H) Kaplan–Meier survival curves of progression-free survival (G) and overall survival (H) in disease controlled patients based on the number of cycles of DAC treatment, using the log-rank test to evaluate significance. PFS, progression-free survival. OS, overall survival.
