Figure 5.

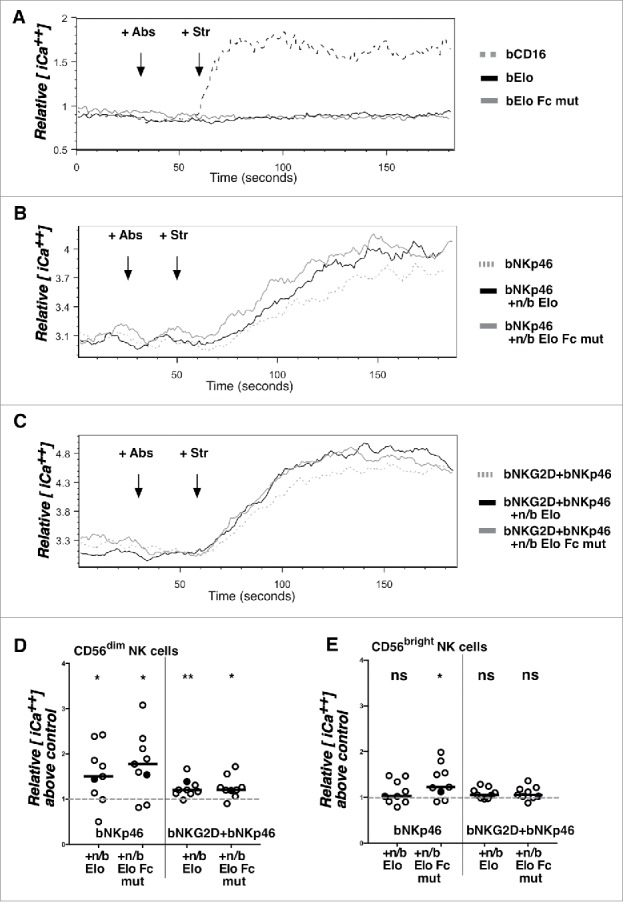
Co-activation of calcium signaling responses by SLAMF7 engagement with elotuzumab. A) PBMCs from healthy donors were loaded with indo-1-AM and stained for CD56 and CD3 before analysis by flow cytometry as in Materials and Methods. Cells were analyzed for 30 seconds, treated with antibodies (+Abs) [biotinylated anti-CD16 (bCD16; dashed gray line), bElo (solid black line), or bElo Fc mutant (solid gray line)], and analyzed for 30 seconds, exposed to streptavidin (+Str) to aggregate antibodies, and analyzed for 2 additional minutes. Relative mean intracellular calcium concentration [iCa2+] is indicated from the mean ratio of violet (405 nm) to blue (485 nm) emission over time in gated CD56dim NK cells. B) PBMCs were stimulated using biotinylated anti-NKp46 alone (+bNKp46; dashed gray line) or in combination with non-biotinylated (+n/b) Elo (black solid line) or +n/b Elo Fc mutant (gray solid line) at 30 seconds, then streptavidin 30 seconds later. C) PBMCs were stimulated using biotinylated anti-NKG2D + biotinylated anti-NKp46 mAbs (bNKG2D+bNKp46; dashed gray line) or these 2 biotinylated mAbs in combination with non-biotinylated (+n/b) Elo (black solid line) or +n/b Elo Fc mutant (gray solid line) at 30 seconds, then streptavidin 30 seconds later. D,E) Individual icons represent the increase of relative mean intracellular calcium concentration above control (+bNKp46 or bNKG2D+bNKp46 alone normalized to a value of 1) for CD56dim NK cells (D) or CD56bright NK cells (E) from 9 healthy donors. Relative intracellular calcium values for the gated NK cell populations from each donor were calculated by determining the area under the curve for mean 405nm/485nm emission ratios between 120–180 seconds in Elo-treated samples (+bNKp46 ± bNKG2D + Str as indicated) divided by area under the curve values for the same time window in samples treated with bNKp46 + Str alone (left) or bNKp46 + bNKG2D + Str alone (right). Conditions with and without n/b Elo or Elo Fc mutant were compared by 2-sided Wilcoxon matched-pairs signed rank test, *- P < 0.05, **- P < 0.01. Filled circles indicate ratio values for the representative donor shown in panels (B) and C.
