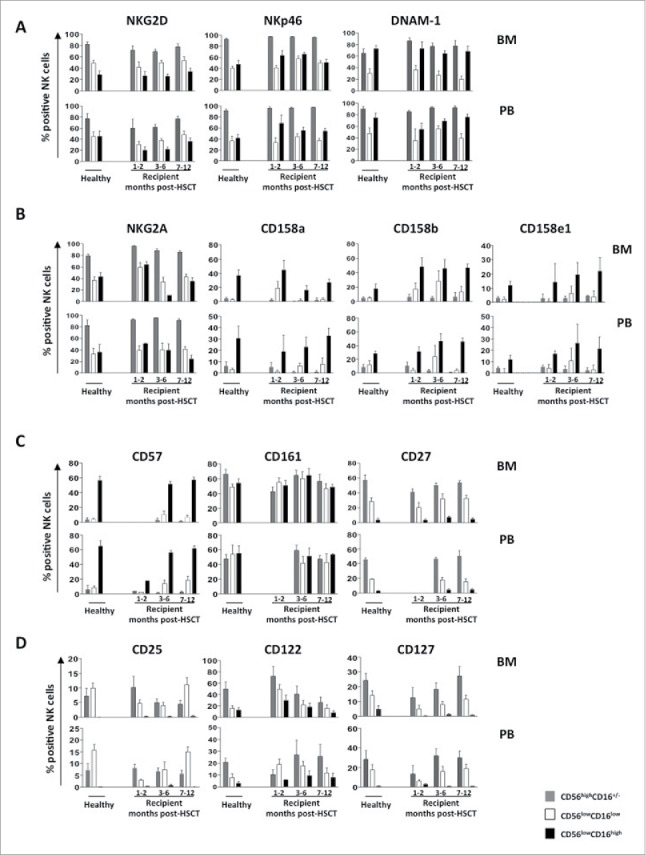
Figure 2.

BM and PB CD56lowCD16low NK-cell phenotype at different time points after transplant. Cells freshly isolated by density gradient centrifugation from BM and PB of pediatric healthy donors and haplo-HSCT recipients were analyzed by flow cytometry for the expression of activating receptors (panel A), MHC class I-specific inhibitory receptors (panel B), differentiation markers (panel C) and cytokines receptors (panel D). The CD56highCD16+/− (gray), CD56lowCD16low (white) and CD56lowCD16high (black) NK cell subsets were gated on CD56+CD3− NK cells. Histograms represent the mean value ± SD of the percentage of positive cells analyzed at different time-points after HSCT starting from the first month until 12th month.
