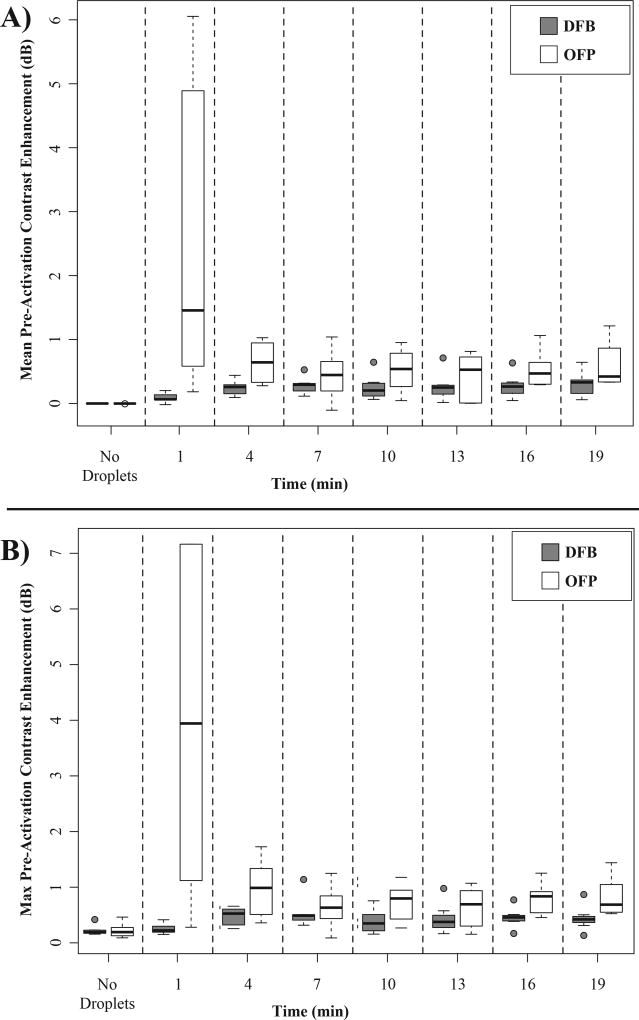
Figure 7.
Change in dB enhancement relative to the mean of the agent-free baseline. A) Initially, the pre-activation signal value is zero-mean, but shifts upward on the order of 0.5 dB over the test period. Similarly, B) the maximum value produced in the video sequence shifts on the order of 0.5 to 1 dB during the test period. It is expected that these changes are due to accumulated shifts in animal positioning over the period. Also visible in A) and B) is the high contrast produced by unwanted activation of OFP droplets at the 1 minute time point.

