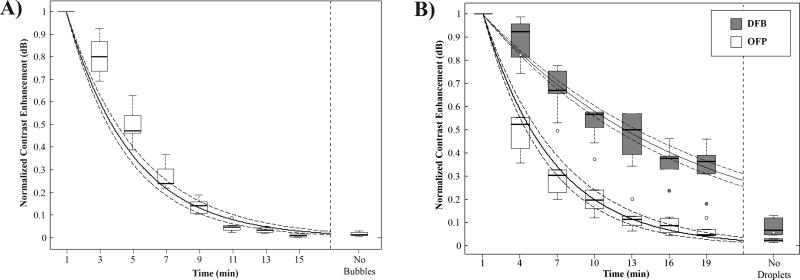
Figure 8.
Maximum contrast enhancement over the mean of the agent-free baseline normalized to the maximum value produced by each animal for A) microbubbles and B) droplets. DFB decayed at a significantly slower rate than OFP and microbubbles, resulting in contrast production half-lives on the order of 3-fold longer than microbubbles and OFP droplets. Shown in solid lines are the exponential curve fits to the grouped data, with 95% confidence intervals in dashed lines.

